Burden of Property Debt in Britain
Information released today from the Office of National Statistics has revealed that the property debt crisis in Great Britain is worsening, as is the financial debt situation in general.
Using evidence from the Wealth and Assets survey, the self-reported burden of property debt was investigated, highlighting the financial crisis Brits currently face. Property debt is recorded as the total outstanding value of the mortgage on a household’s main residence and additional properties. Total household property debt was estimated to have increased from 980 billion in 2008-2010 to a hefty 1 trillion in 2010-2012. Financial debt sat at around 104 billion in 2012; this is significantly less than the property debt balance, serving to highlighting the sheer extent of mortgages taken out.
How many people feel the burden of debt?
The effect of this is a very real burden put upon a substantial sector of home owners who are seemingly struggling; 10.6% of households reported a heavy property debt burden in 2010-2012, an improvement from 11.3% in 2008, however still a significant amount. 42.1% of these individuals were in the lowest wealth decile, compared to only 2.4% in the highest wealth decile, as would be expected.
As for financial debt burden in general, 19.8% of all households reported a heavy financial debt burden. This study went on to make comparisons between households in the highest to lowest wealth deciles, and households with the highest to lowest net income.
Statistics indicated only 5.8 percent of individuals in the highest net income decile reported a heavy burden compared to 33.9% in the lowest income decide.
Following on from this, figures revealed that 3.2 percent of households in the highest wealth decile reported a heavy debt burden whereas 39.6 in the lowest decile recounted their debt problem as a heavy burden.
Although not surprising with regard to differences between debt burdens on either side of the wealth scale, the information still displays an unexpectedly high percentage of people that feel their household debt is a heavy burden.
Property debt burden 2008-10 vs 2010-12
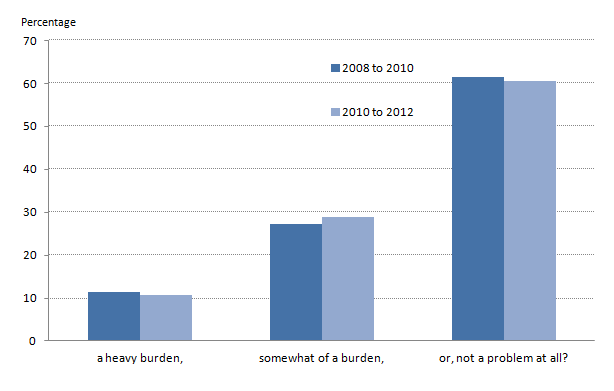
The graph below shows the Burden of Property Debts, 2008-2010 and 2010-2012
Half of households owning their main residence with a mortgage owed at least £80,000, which is an increase from £50,000 in 2008 to 2010. The mortgage value on other properties remained at a constant £84,000 from 2008 to 2012.

Credit to ONS
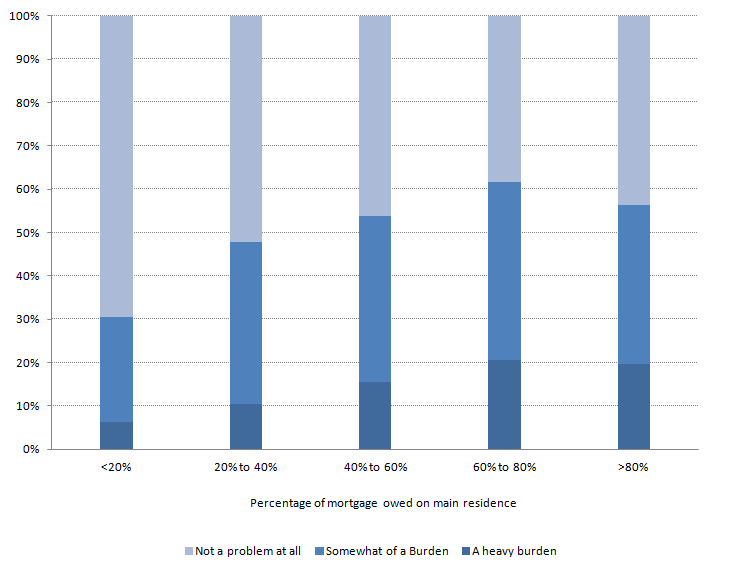
Households that reported having property liabilities were asked to think about how their mortgage(s) are a burden on their main household. Overall households that reported their property debt as a heavy burden improved from 11.3% in 2008 to 2010 to 10.6% in 2010 to 2012. Reports of having somewhat of a burden worsened slightly from 27.2 (2008 to 2010) to 28.9% (2010 to 2012).

Credit to ONS
What is the average property debt per region in the UK?
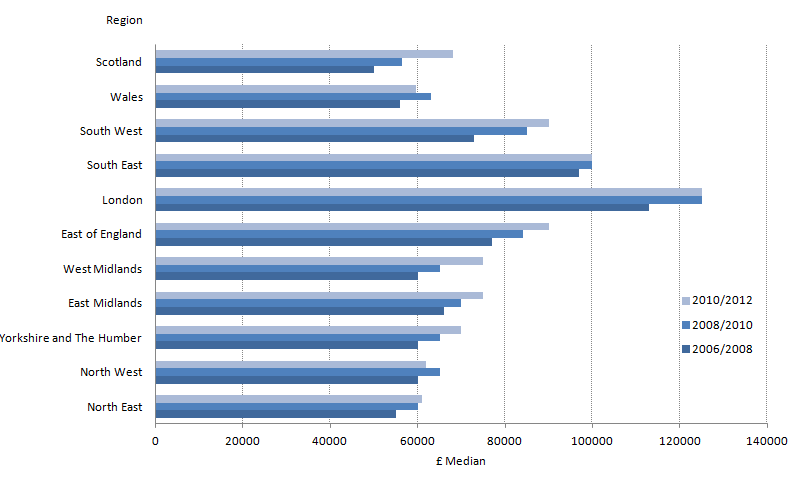
Another interesting angle that was examined was the differences in financial burdens felt in different regions of the UK. As shown in the figure below, London had the highest median property debt across the 6 years. In 2010 to 2012, it recorded a median of £131,000 in debt. This was followed by the South East with £105,000. In comparison, the lowest median property debt came from Wales (£56,000), North West (£62,000) and the North East (£63,000). Scotland’s median debt has increased by £20,000 between the years or 2006 to 2008 (£50,000) and 2010 to 2012 (£70,000).

Credit to ONS
This supports the common North/South divide theory, indicating that it is in fact much more expensive to buy a house in London and the surrounding areas, and relatively cheap to buy in the North and in Wales. Consequently, property and financial debt burden is higher in the dearer areas aforementioned.


