
The Best Places to Buy and Sell Property in England (2026)
Whether you’re buying a home, selling a property or deciding where to invest, the strongest property markets aren’t necessarily the places with the highest house prices.
A combination of long-term growth, affordability and quality of life can all influence whether an area is among the best places to buy a house in the England. Selling conditions matter too, particularly for homeowners and landlords who may want the flexibility to move or release property from a portfolio.
To uncover England’s strongest property markets and some of the best cities for property investment, we analysed major cities and towns across three areas: investment potential, affordability and quality of life. Factors ranged from five and 10-year house-price growth and average selling times to mortgage affordability, crime, life satisfaction and green-space access.
| For homeowners considering their next move, the findings reveal where property ownership currently offers the strongest overall balance, and where those looking to Sell House Fast may face a more challenging market. |
Key findings
- Blackburn with Darwen is England’s best place for property prosperity, with a score of 7.67/10.
- Nine of the top 10 places are in northern England, including Warrington, Salford, Sunderland, Bolton, Liverpool, Newcastle upon Tyne, Bradford, and Blackpool.
- Blackburn with Darwen has recorded the strongest five-year house-price growth, at 34.2%.
- Salford has seen the strongest 10-year house-price growth, at 83.3%, and also has the shortest average selling time at 142 days.
- Middlesbrough has the lowest house price-to-salary ratio, at 4.6, with an estimated mortgage using 26.5% of the average monthly salary.
- London ranks last overall, scoring 1.80/10, with a house price-to-salary ratio of 13.7 and an estimated mortgage using 79.4% of the average monthly salary.
Jack Malnick, Managing Director at Sell House Fast, comments:
“There’s a tendency to assume that the strongest property markets are automatically the most expensive, but our findings show why that isn’t always the case.
“For buyers and landlords, strong historic growth is important, but so is the price you have to pay to enter the market. Homeowners also need to consider how quickly they may be able to sell and what an area offers day to day.
“That balance helps explain why so many northern locations perform strongly in the index. They can combine meaningful property growth with housing costs that remain more manageable relative to local earnings.”
England’s best places to buy and sell property in 2026
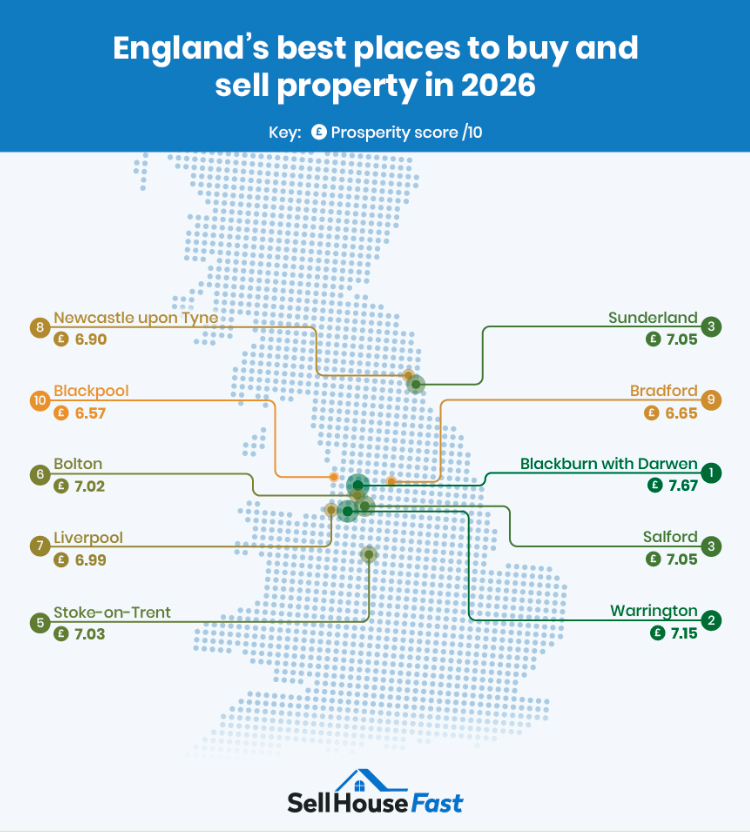
Blackburn tops the Property Prosperity Index, followed by Warrington, while Salford and Sunderland share third place.
The top of the table is heavily concentrated in northern England, with Stoke-on-Trent the only top-10 location outside the North.
For buyers wondering where the best place to buy a house in England could be in 2026, the rankings point firmly towards the North
| Rank | Area | 5-year house price increase | 10-year house price increase | Average selling time (days) | House price-to-salary ratio | Percentage of monthly salary used for mortgage | Prosperity score /10 |
| 1 | Blackburn with Darwen | 34.2% | 72.7% | 157 | 6.0 | 34.9% | 7.67 |
| 2 | Warrington | 25.7% | 58.4% | 179 | 7.4 | 43.1% | 7.15 |
| 3 | Salford | 25.7% | 83.3% | 142 | 7.6 | 43.9% | 7.05 |
| 3 | Sunderland | 20.0% | 38.9% | 191 | 5.2 | 30.2% | 7.05 |
| 5 | Stoke-on-Trent | 25.0% | 57.1% | 150 | 5.2 | 30.2% | 7.03 |
| 6 | Bolton | 30.1% | 73.5% | 234 | 6.8 | 39.5% | 7.02 |
| 7 | Liverpool | 28.0% | 69.6% | 239 | 6.0 | 34.6% | 6.99 |
| 8 | Newcastle upon Tyne | 23.7% | 37.3% | 205 | 6.9 | 39.8% | 6.90 |
| 9 | Bradford | 29.3% | 58.2% | 185 | 6.6 | 38.2% | 6.65 |
| 10 | Blackpool | 18.8% | 41.0% | 225 | 4.8 | 27.8% | 6.57 |
1. Blackburn with Darwen: England’s top property market also leads for five-year house-price growth
Blackburn with Darwen takes first place in the Property Prosperity Index with a score of 7.67/10, supported by particularly strong house-price growth.
Prices have increased by 34.2% over five years, the highest rise recorded in the study, while the 10-year increase stands at 72.7%. Properties also have an average selling time of 157 days, while the area’s house price-to-salary ratio sits at 6.0, and estimated mortgage repayments are equivalent to 34.9% of average monthly salary.
The area has also experienced population growth over the past decade. According to Office for National Statistics Census data, Blackburn with Darwen’s population increased by 4.9% between 2011 and 2021, from just under 147,500 to around 154,700 people.
That growing population provides useful context for the strength of the local property market, with demand for housing sitting alongside some of the strongest recent house-price growth recorded in our study.
2. Warrington: Second overall, with one of the lowest crime rates in the study
Warrington ranks second in the Property Prosperity Index with a score of 7.15/10, performing strongly across both property and quality-of-life measures.
House prices have increased by 25.7% over five years and 58.4% over 10 years, while properties have an average selling time of 179 days.
Its strong result comes against a backdrop of wider economic growth. Centre for Cities’ Cities Outlook 2026, reported by Warrington Borough Council, found that disposable income in Warrington increased by 5.3% between 2013 and 2023, compared with 2.4% nationally. This placed the town fifth out of 63 major UK urban areas for growth in living standards.
Over the same period, Warrington’s economic output increased by 41%, compared with 18.4% nationally, adding further context to its position among the strongest property markets in the index.
3. Salford and Sunderland take joint third – for very different reasons
Salford and Sunderland both achieve a Property Prosperity score of 7.05/10, but the data shows two very different routes into the top three.
Salford
Salford stands out for investment potential. House prices have risen by 83.3% over 10 years, the biggest increase recorded in the study, while its 142-day average selling time is also the shortest.
That growth has coincided with major development across the city. According to Salford City Council’s regeneration figures, 20,344 new homes have been built in Salford over the past decade, including 3,201 affordable homes.
Salford’s business base has also expanded significantly. The city is now home to around 11,000 businesses, an increase of 85% since 2010, supporting approximately 159,000 jobs. Looking ahead, the council has set out an ambition to deliver 40,000 new homes and 40,000 new jobs by 2040 across its strategic growth areas.
Sunderland
Sunderland, meanwhile, performs more strongly on affordability. Its house price-to-salary ratio stands at 5.2, while estimated mortgage repayments use 30.2% of average monthly salary.
The city is also continuing to attract regeneration funding. Under the Government’s Pride in Place programme, two Sunderland communities have been allocated a combined £40 million, with £20 million being invested in each area over 10 years to support long-term local improvements. Sunderland City Council says the funding is intended to revitalise neighbourhoods and deliver lasting change for people who live and work there.
Nine of England’s top 10 property markets are in northern England
Northern England dominates the highest end of the Property Prosperity Index, accounting for nine of the top 10 locations.
Blackburn, Warrington, Salford, Sunderland, Bolton, Liverpool, Newcastle upon Tyne, Bradford and Blackpool all feature in the top 10, with Stoke-on-Trent the only exception.
House-price growth is one recurring strength. Blackburn records a 34.2% five-year increase, Bolton 30.1%, Bradford 29.3% and Liverpool 28.0%.
Affordability also helps several northern markets stand out. Blackpool has a house price-to-salary ratio of 4.8, Sunderland 5.2 and Liverpool 6.0.
The rankings suggest that many northern markets are benefiting from a combination of property growth and comparatively manageable purchase costs, rather than relying on a single standout measure.
Jack Malnick comments:
“Lower property prices can give buyers and investors more room to enter a market without such a large proportion of their income immediately being absorbed by housing costs.
“What is particularly interesting here is that affordability isn’t necessarily coming at the expense of growth. Several of the northern locations that rank highly have also seen substantial house price increases over the past five or 10 years.
“For existing homeowners, that combination can also be important when considering whether to stay in an area, move elsewhere or release equity from a property.”
Salford house prices have risen 83.3% in 10 years – the biggest increase in the study
Salford stands out among the best cities for property investment, recording the strongest long-term house-price growth of any location analysed.
Property prices have risen by 83.3% over 10 years, placing Salford ahead of Bolton on 73.5% and both Manchester and Blackburn with Darwen on 72.7%.
| Rank | Area | 10-year house price increase | Overall prosperity rank |
| 1 | Salford | 83.3% | 3 |
| 2 | Bolton | 73.5% | 6 |
| 3 | Manchester | 72.7% | 24 |
| 4 | Blackburn with Darwen | 72.7% | 1 |
| 5 | Liverpool | 69.6% | 7 |
Historic growth alone, however, does not guarantee a high overall Property Prosperity ranking.
While Blackburn with Darwen ranks first overall and Salford joint third, Manchester places 24th despite recording the same displayed 10-year increase as Blackburn with Darwen at 72.7%.
That distinction highlights the index’s broader purpose: investment potential is only one part of the picture, alongside affordability and quality of life.
Salford also has the shortest average selling time in the study
Salford also records the shortest average selling time in the study, at 142 days, ahead of Stoke-on-Trent at 150 days and Blackburn with Darwen at 157 days.
| Rank | Area | Average selling time (days) |
| 1 | Salford | 142 |
| 2 | Stoke-on-Trent | 150 |
| 3 | Blackburn with Darwen | 157 |
| 4 | Slough | 159 |
| 5 | Crawley | 163 |
Its faster-moving market sits alongside several factors that may help support buyer and renter demand. Salford Quays and MediaCity form a major employment and regeneration hub, home to the BBC, ITV and more than 250 creative and technology businesses. MediaCity is also expected to double in size over the next decade, with further housing and commercial development planned.
Salford also benefits from the University of Salford, a significant student population and strong transport links into Manchester, including rail and Metrolink connections. Together, its employment base, university presence and proximity to central Manchester provide useful context for why demand may remain relatively strong.
Jack Malnick comments:
“Price growth understandably attracts attention from investors, but the ability to sell a property is another important consideration.
“An area where values have grown strongly, but sellers face a much slower market, may present a different proposition from somewhere that combines appreciation with relatively faster selling times.
“Salford stands out because it performs strongly on both of those measures in this study.”
Middlesbrough is the most affordable place to buy, with homes worth 4.6 times local salaries
Middlesbrough offers the strongest housing affordability of the locations analysed, with an average house price equivalent to 4.6 times local annual salary.
Blackpool follows with a house price-to-salary ratio of 4.8, while Kingston upon Hull records 4.9.
| Rank | Area | House price to salary ratio | Percentage of monthly salary used for mortgage |
| 1 | Middlesbrough | 4.6 | 26.5% |
| 2 | Blackpool | 4.8 | 27.8% |
| 3 | Kingston upon Hull | 4.9 | 28.3% |
| 4 | Stoke-on-Trent | 5.2 | 30.2% |
| 4 | Sunderland | 5.2 | 30.2% |
Middlesbrough also has the lowest estimated mortgage burden, with repayments equivalent to 26.5% of the average monthly salary.
In Blackpool, the equivalent figure is 27.8%, while Kingston upon Hull stands at 28.3%.
Stoke-on-Trent and Sunderland both record a house price-to-salary ratio of 5.2, with estimated repayments using 30.2% of the average monthly salary.
Almost four-fifths of the average monthly salary would go towards an estimated mortgage in London
At the opposite end of the affordability rankings, estimated mortgage repayments in London are equivalent to 79.4% of the average monthly salary.
Oxford follows at 75.2%, while Cambridge and Brighton and Hove both record 69.9%.
| Rank | Area | House price to salary ratio | Percentage of monthly salary used for mortgage |
| 1 | London | 79.4% | 13.7% |
| 2 | Oxford | 75.2% | 13.0% |
| 3 | Cambridge | 69.9% | 12.1% |
| 3 | Brighton and Hove | 69.9% | 12.1% |
| 5 | Watford | 61.7% | 10.6% |
London also has the highest house price-to-salary ratio in the study at 13.7, followed by Oxford at 13.0.
The affordability squeeze is reflected in wider housing data too. According to the Office for National Statistics, the average London home sold for 10.6 times average annual earnings in 2025 — the highest ratio of any region in England and Wales. The latest UK House Price Index also puts the average London first-time buyer property at £465,145.
Higher salaries don’t necessarily translate into greater buying power: in the most expensive markets, property values can absorb a much larger share of local earnings.
All of the 10 lowest-ranked property markets are in the southern half of England
All 10 of the lowest-ranked locations are in southern England, with London taking the bottom position, followed by Brighton and Hove and Cambridge.
| Rank | Area | 5-year house price increase | 10-year house price increase | Average selling time (days) | House price-to-salary ratio | Percentage of monthly salary used for mortgage | Prosperity score /10 |
| 1 | London | 4.2% | 8.9% | 266 | 13.7 | 79.4% | 1.80 |
| 2 | Brighton and Hove | 6.0% | 23.9% | 275 | 12.1 | 69.9% | 1.90 |
| 3 | Cambridge | 6.0% | 5.2% | 226 | 12.1 | 69.9% | 2.64 |
| 3 | Bournemouth, Christchurch and Poole | 7.6% | 24.4% | 283 | 9.9 | 57.4% | 2.67 |
| 5 | Reading | 13.4% | 14.2% | 253 | 9.9 | 57.4% | 2.68 |
| 6 | Watford | 3.6% | 16.7% | 245 | 10.6 | 61.7% | 2.71 |
| 7 | Southend-on-Sea | 10.5% | 34.8% | 247 | 9.8 | 56.8% | 2.79 |
| 8 | Exeter | 7.8% | 30.0% | 256 | 9.5 | 55.2% | 2.87 |
| 9 | Oxford | 4.2% | 15.4% | 214 | 13.0 | 75.2% | 3.03 |
| 10 | Bristol | 14.4% | 42.0% | 243 | 10.4 | 60.4% | 3.14 |
London ranks last for property prosperity
London records the lowest Property Prosperity score in the study at 1.80/10.
House prices have increased by 4.2% over five years and 8.9% over 10 years, while properties have an average selling time of 266 days.
Affordability is one of the clearest challenges. The capital records a house price-to-salary ratio of 13.7, the highest in the study, while an estimated mortgage uses 79.4% of the average monthly salary.
Brighton and Hove places second from the bottom with a score of 1.90/10. Its house price-to-salary ratio stands at 12.1, with estimated mortgage repayments equivalent to 69.9% of the average monthly salary.
Cambridge follows with a score of 2.64/10, while its 5.2% 10-year house-price increase is the weakest long-term growth figure in the bottom 10.
Jack Malnick says:
“An expensive property market can look attractive on paper because values are high, but that does not automatically mean it offers the strongest conditions for buyers, sellers or landlords.
“When homes cost a much larger multiple of local earnings, buyers can face considerably greater pressure from mortgage repayments. That can affect everything from who can enter the market to how much flexibility homeowners have as their circumstances change.
“Looking beyond headline property values gives a much fuller picture of how a market is actually performing for the people living and investing there.”
From crime to green space: the cities standing out for quality of life
Property prosperity isn’t only about how much a home costs or how quickly its value has grown.
Crime, wellbeing, green space access and transport connections can all influence which areas people consider among the best places to live in England
York records the lowest crime rate in the study
| Rank | Area | Total recorded crime per 1,000 people |
| 1 | York | 65.7 |
| 2 | Swindon | 69.6 |
| 3 | Warrington | 70.4 |
| 4 | Telford | 73.0 |
| 5 | Luton | 82.2 |
York has the lowest recorded crime rate of the locations analysed, at 65.7 offences per 1,000 people.
Swindon follows at 69.6, while second-place overall Warrington records 70.4 offences per 1,000 people.
Oxford and Colchester record the highest life satisfaction scores
Oxford records the highest life satisfaction score in the study at 7.80/10, narrowly ahead of Colchester at 7.78.
Ipswich follows at 7.62, while West Northamptonshire and Crawley both record 7.59.
| Rank | Area | Life satisfaction score /10 |
| 1 | Oxford | 7.80 |
| 2 | Colchester | 7.78 |
| 3 | Ipswich | 7.62 |
| 4 | West Northamptonshire | 7.59 |
| 4 | Crawley | 7.59 |
Oxford’s result also highlights why quality of life alone cannot determine property prosperity. Despite recording the highest life satisfaction score, the city sits among the 10 lowest-ranked property markets overall, with a Property Prosperity score of 3.03/10.
Milton Keynes offers the most green space per person
Milton Keynes leads the study for green-space provision, with 59.3 m² per person.
Stoke-on-Trent follows with 52.4 m², while Peterborough residents have access to 41.9 m² per person.
| Rank | Area | Green space per person (m²) |
| 1 | Milton Keynes | 59.3 m² |
| 2 | Stoke-on-Trent | 52.4 m² |
| 3 | Peterborough | 41.9 m² |
| 4 | Swindon | 39.9 m² |
| 5 | Warrington | 37.6 m² |
Stoke-on-Trent is particularly notable because it combines the second-highest green-space provision with a fifth-place overall Property Prosperity ranking of 7.03/10.
Warrington also appears in the top five for green space while ranking second overall, giving the area another quality-of-life strength alongside its comparatively low crime rate.
Thinking about moving or selling your property?
Property prices are only one part of deciding where – and when – to move.
For some homeowners, relocating may mean finding a more affordable area or moving to somewhere they consider one of the best places to live in England. Others may be landlords looking to release a property from their portfolio, or owners who simply want greater certainty about their next move.
If you need to sell without relying on a lengthy property chain, Sell House Fast can provide an alternative to the traditional open-market process and help give homeowners greater certainty over their selling timeline.
Methodology
Sell House Fast is a leading UK cash house buyer, helping homeowners achieve a guaranteed sale without the uncertainty or waiting times of the open market – completing sales in as little as seven days.
We created a seed list of the most populated towns and cities in England and ranked them across three categories, each with equal 33% weighting:
- Investment potential
- Affordability
- Quality of life
Where data was available at local authority level, each city was matched to its corresponding local authority.
Each factor was normalised into a score out of 10 before being combined into the overall Property Prosperity Index.
1. Investment potential
Five and 10-year house-price growth
We used the HM Land Registry UK House Price Index to collect average house prices by local authority.
We compared current average house prices with those from five and 10 years ago to calculate percentage growth over each period. Higher house-price growth scored more favourably.
Average time to sell
We used Home.co.uk house price data to collect the average time taken to sell a property, based on the period from listing to completion.
The data is shown in days and is based on the previous 90 days of data. Shorter average selling times scored more favourably.
2. Affordability
House price-to-income ratio
We used the HM Land Registry UK House Price Index to collect average house prices by local authority.
We used the ONS Annual Survey of Hours and Earnings to collect median annual pay for all employees by local authority, based on place of residence.
We then calculated the house price-to-income ratio by dividing the average house price by median annual pay. Lower ratios scored more favourably.
Average mortgage payment as a percentage of earnings
We calculated the estimated average monthly mortgage payment for each city or local authority using a standard repayment mortgage formula.
This was based on:
- Average house price
- 10% deposit
- 30-year mortgage term
- 5% interest rate
- Repayment mortgage
We then compared the estimated monthly mortgage payment with median monthly earnings to calculate mortgage affordability.
Lower mortgage payments as a percentage of earnings scored more favourably.
3. Quality of life
Crime rate
We used the ONS Crime in England and Wales: Police Force Area data tables to collect the number of recorded offences per 1,000 people.
Lower crime rates scored more favourably.
Life satisfaction
We used ONS personal wellbeing data to collect average life satisfaction scores by local authority.
Higher life satisfaction scores scored more favourably.
Green space access
We used the Fields in Trust Green Space Index to collect green-space provision per person, measured in square metres, for each local authority.
Higher green-space provision scored more favourably.
Access to employment centres
We used Department for Transport travel-time data to identify the average public transport and walking time, in minutes, to the nearest employment centre with 500 or more jobs.
Shorter travel times scored more favourably.
Broadband speed
We used ThinkBroadband local authority data to collect broadband speed data by local authority.
Higher broadband speeds scored more favourably.
Scoring
Each factor was normalised into a score out of 10.
Scores were then created for each of the three main categories – investment potential, affordability and quality of life – before the three category scores were averaged to produce the final Property Prosperity Index score.