Where Has the Highest Amount of Dangerous Homes in England?
Most of us see our homes as a sanctuary – a place to feel safe, relaxed, and at ease. But for many owners and tenants across England, that sense of security is being compromised.
Government data shows that 15% of homes in England are classed as ‘non-decent’, meaning they fail to meet basic health, safety, or comfort standards.1 In some areas, that figure is even higher.
Whether it’s damp and mould or faulty wiring and structural issues, these problems can seriously affect both well-being and property value.
In this report, Sell House Fast aims to raise awareness on national issues relating to the need for improved property maintenance and potential impacts on market value for sellers. We reveal:
- The parts of England with the highest proportion of unsafe or ‘non-decent’ homes
- The most common household hazards affecting residents’ health
- How these issues can impact property prices, and what options homeowners have if repairs are unaffordable, including selling quickly to a cash house buyer
Which English regions have the most non-decent homes?
A non-decent home is defined by having major defects that could be a risk to the health and safety of the occupants in those homes and the people surrounding them.
Common issues in non-decent homes are structural problems, including leaking roofs and unsafe floors; additionally, a lack of heating, poor electrics, fire hazards, and damp can categorise a home as non-decent.
English regions by the percentage of ‘non-decent’ homes
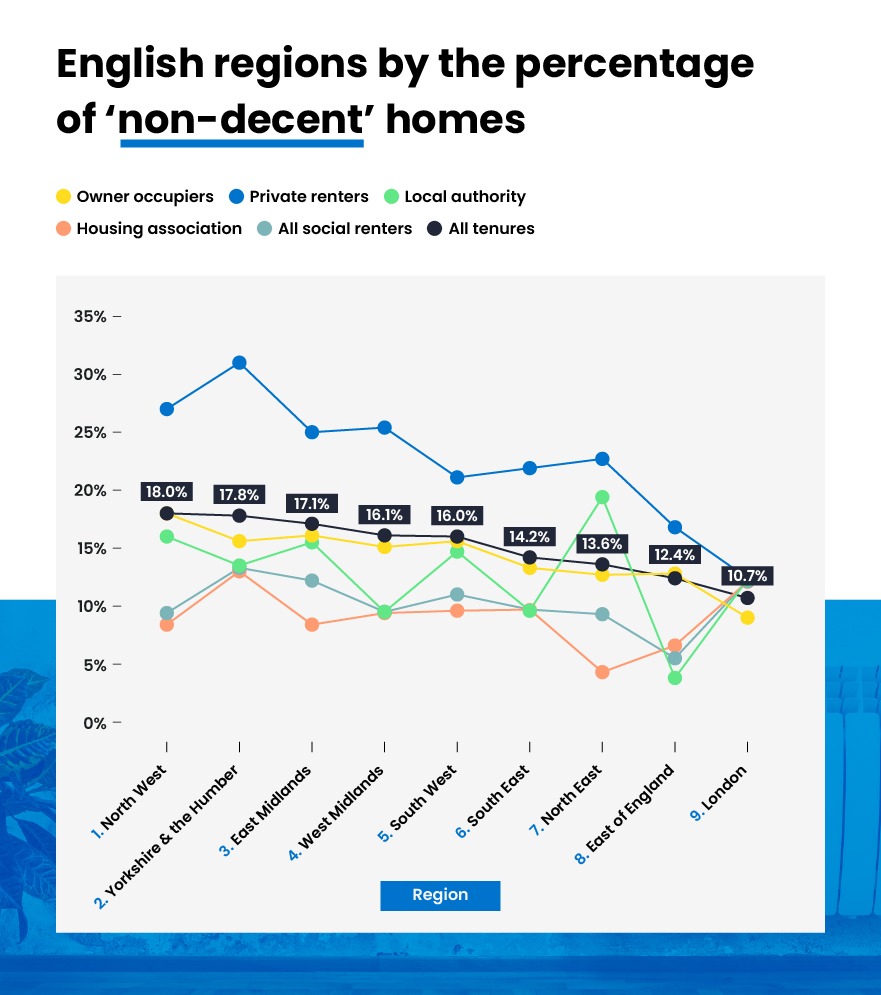
| Rank | Region | Owner occupiers | Private renters | Local authority | Housing association | All social renters | All tenures |
| 1 | North West | 18.0% | 27.0% | 16.0% | 8.4% | 9.4% | 18.0% |
| 2 | Yorkshire and the Humber | 15.6% | 31.0% | 13.5% | 13.0% | 13.3% | 17.8% |
| 3 | East Midlands | 16.1% | 25.0% | 15.5% | 8.4% | 12.2% | 17.1% |
| 4 | West Midlands | 15.1% | 25.4% | 9.5% | 9.4% | 9.5% | 16.1% |
| 5 | South West | 15.6% | 21.1% | 14.7% | 9.6% | 11.0% | 16.0% |
| 6 | South East | 13.3% | 21.9% | 9.6% | 9.7% | 9.7% | 14.2% |
| 7 | North East | 12.7% | 22.7% | 19.4% | 4.3% | 9.3% | 13.6% |
| 8 | East of England | 12.8% | 16.8% | 3.8% | 6.6% | 5.5% | 12.4% |
| 9 | London | 9.0% | 12.4% | 12.3% | 12.1% | 12.2% | 10.7% |
The North West has the highest proportion of non-decent homes
- North West, 18% of homes are non-decent:
The northwest of England has the highest percentage of homes falling into the non-decent category, with almost 20% not being up to a decent standard. In total, there are over 610,000 non-decent homes in the region, also the highest in the country.
The highest percentage was found in private rental properties, 27% of which were non-decent, whereas only 8.4% of Housing Association homes were classified as non-decent.
- Yorkshire and the Humber, 17.8% of homes are non-decent:
Yorkshire and the Humber is only slightly behind the North West, with 17.8% of all homes being classified as non-decent. This figure equates to a total of just over 450,000 homes. This region had the highest percentage of non-decent social housing, as 13.3% are not up to standard.
- East Midlands, 17.1% of homes are non-decent:
The third-highest ranking region for non-decent homes is the East Midlands, as 17.1% of homes are not up to standard. Like in Yorkshire, those living in social housing (either through local authorities or the housing association) have a higher proportion of non-decent homes than many other regions, 12.2%.
Further findings:
- The highest proportion of non-decent homes is found amongst private renters, 21% of all these homes fall into this category. Unlike homeowners, private tenants are usually responsible for reporting faults in their homes to their landlords, who are then responsible for repairing them – the evidence suggests that this system is not fixing as many faults as other living situations.
- There are fewer social rental homes in a non-decent state than private ownership, with just 10.3% of all social homes being classed as non-decent.
- London has the lowest proportion of non-decent homes in England, as only 10.7% of its homes fall into this category.
The English councils with the highest amount of ‘non-decent’ houses
Whilst we have identified the broad regions of the country with the most non-decent homes, we will now delve a little deeper into the statistics to discover the specific local areas of England with the highest proportion of non-decent homes.
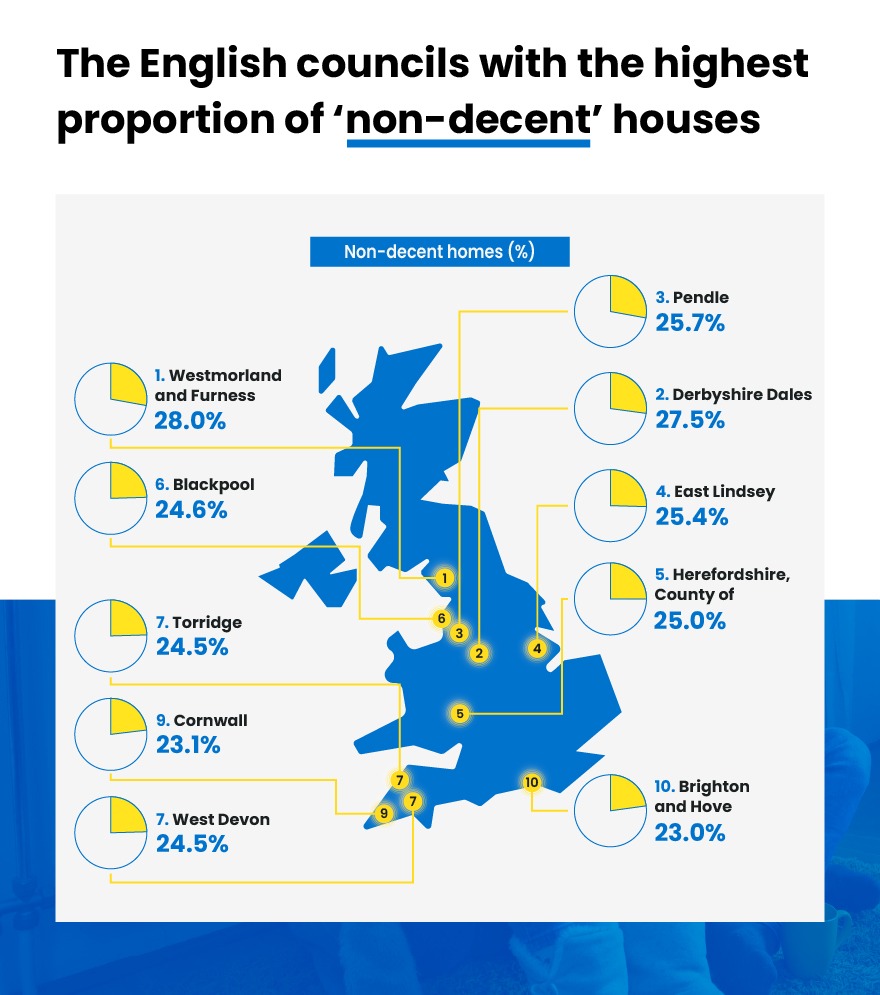
Local authorities by the percentage of ‘non-decent’ homes
| Rank | Local authority | Total homes | Non-decent homes | Non-decent homes (%) |
| 1 | Westmorland and Furness | 106,687 | 29,860 | 28.0% |
| 2 | Derbyshire Dales | 33,997 | 9,339 | 27.5% |
| 3 | Pendle | 39,253 | 10,102 | 25.7% |
| 4 | East Lindsey | 68,150 | 17,294 | 25.4% |
| 5 | Herefordshire, County of | 84,052 | 21,016 | 25.0% |
| 6 | Blackpool | 66,821 | 16,455 | 24.6% |
| 7 | Torridge | 32,329 | 7,911 | 24.5% |
| 7 | West Devon | 26,339 | 6,454 | 24.5% |
| 9 | Cornwall | 266,162 | 61,461 | 23.1% |
| 10 | Brighton and Hove | 128,334 | 29,472 | 23.0% |
Westmorland and Furness has the highest proportion of non-decent homes
- Westmorland and Furness, 28% of homes are non-decent:
Residents in the newly formed Cumbrian council area are dealing with the highest proportion of non-decent homes. The authority encompasses some of the most deprived towns in the country, located in West Cumbria, and perhaps this is one of the reasons why over 40% of private rental properties are non-decent. On top of this, more than a quarter of its owner-occupied homes are non-decent, 26.7%.
- Derbyshire Dales, 27.5% of homes are non-decent:
Just behind Westmorland and Furness is the Derbyshire Dales, where 27.5% of homes are non-decent. The area is filled mainly with the Peak District, and is home to towns such as Bakewell, Matlock and Ashbourne. There is a particular problem for social housing in the Dales, as almost a fifth of all socially rented properties are non-decent.
- Pendle, 25.7% of homes are non-decent:
Another northern council area completes the top three, which is indicative of that region having the highest proportion of non-decent homes. In this East Lancashire area, over a quarter of the homes are categorised as non-decent.
Further findings:
- Despite being one of the most affluent council areas in England, Kensington and Chelsea has a real problem with the quality of social housing. Out of all the social homes in the area, over 20% are in a non-decent state, a far cry from the glitz and glamour of Harrods, Knightsbridge, and Notting Hill, which the area is famous for.
- Calderdale in West Yorkshire has the highest proportion of non-decent private rental homes; over two-fifths (42.2%) of private tenants have to deal with serious issues, the most of any in the country.
- Basildon and Wokingham are tied as the two council areas with the lowest proportion of non-decent homes; residents of these areas are more likely to be satisfied with the safety of their home, as only seven in a hundred (7.3%) of all homes have significant issues.
The most common serious problems affecting non-decent homes
A category one home issue is a hazard that poses a real risk to the health and safety of the occupants or guests in the home. Furthermore, it is such a risk that the council will have a legal obligation to take action to resolve the issue.
In 2023, almost 2 million category one issues were identified across houses in England; this means there is one in 7.9% of all homes.
Most reported category one issues in English homes

| Rank | Hazard | Owner occupiers | Private renters | Social renters | All tenures |
| 1 | Falls on stairs | 564,783 | 207,208 | 54,608 | 826,599 |
| 2 | Excess cold | 437,725 | 114,373 | 14,482 | 566,580 |
| 3 | Falls on the level | 145,963 | 53,902 | 24,151 | 224,016 |
| 4 | Falls between levels | 121,589 | 31,086 | 12,425 | 165,100 |
| 5 | Damp | 55,659 | 75,485 | 30,828 | 161,972 |
Jack Malnick, Managing Director of Sell House Fast, comments on this issue:
“It is a shocking statistic that almost 4 million homes in England are categorised as non-decent, meaning that nearly 15% of homes and around 9 million people are living in substandard housing, which could be potentially life-threatening and dangerous.
“Moreover, almost half a million people living in social housing are living in non-decent homes, a statistic that councils and housing associations will hope to decrease in recent years. Moreover, many private landlords appear to be letting tenants down; 20% of private lettings (over 1 million homes) are non-decent.
“There are also over 2.3 million owner-occupied homes that are non-decent, meaning that 14.3% of homeowners will struggle to sell their homes due to the severe issues. To combat this, it is important that homeowners recognise and resolve any major home issues, especially if they are category one hazards.
“Tripping hazards and structural issues are especially problematic, as falls on stairs can be extremely dangerous and lead to serious injury. Often, uneven floors and loose wires can be an easy fix to eliminate this category one issue.
“It is also important to keep your home insulated and well-heated, as excessive cold and damp are a category one hazard; consequently, a properly insulated home can increase home value by an average of 14% and potentially save people hundreds of pounds per year on energy bills.
“If you tackle major issues that could make your home non-decent, you could not only increase your standard of living, but also add value to your home and make it much easier to sell. On top of this, if you do not own your home, it is important to report issues to your private landlord or council to tackle these major issues before they can harm you and your home.”
Methodology
Sell House Fast is a leading UK cash house buyer who specialises in helping homeowners secure a guaranteed property sale swiftly and without the delays they may encounter with traditional estate agents. This is achieved by directly purchasing the property with cash and handling the entire process for our customers, meaning a sale can be completed in as little as seven days.
As property values are often highly influenced by the environment in which people live, and the defects of any property, we wanted to see which local authorities and areas of England have the best and worst rates of poor quality homes on average.
To do this, we analysed the following data from the English Housing Survey, specifically:
- AT 1.5: Non-decent homes, by tenure and region, 2006 to 2023
- AT 1.6: HHSRS Category 1 hazards, by tenure, 2008 to 2023
The number and percentage of non-decent homes by local authority were sourced from the Official Statistics in Development.
Note: “Non-decent homes” refers to homes that fail to meet the Decent Homes Standard, i.e. those that have at least one Category 1 hazard, are in a poor state of repair, lack modern facilities, or do not provide a reasonable degree of thermal comfort.
“Category 1 hazards” refers to the most serious health and safety risks identified under the Housing Health and Safety Rating System, such as damp and mould, excess cold, fire risk, and structural hazards.
All data was collected in October 2025 and is correct as of then.