Mapping the UK’s Mortgage Burden: Where Homes Are Most and Least Affordable
Across the UK, the average homeowner now spends over half (50.9%) of their salary on mortgage repayments… and that’s far above what most people think is affordable. In our new poll, over four-fifths (84%) of Brits said spending more than 35% of their income on housing costs feels unreasonable.
To see where homeowners are under the most pressure, the cash house buyers at Sell House Fast analysed mortgage and salary data across the UK.
Our analysis combined figures from the ONS Annual Survey of Hours and Earnings with average house prices from the UK House Price Index. Assuming a 20% deposit and using the Bank of England’s base rate to calculate typical repayment costs, we worked out how much of the average local salary goes towards annual mortgage payments in each area.
From this, we’ve uncovered where people are spending the biggest share of their take-home pay on their homes, and where buying still feels affordable.
Use our interactive map to find out what mortgage payments are like where you live.
Find out how affordable mortgages in your local area are
We’ve analysed over 350 local authorities in the UK, and out of these:
- Eight have average mortgage payments of less than 25% of the local salary
- 106 have average mortgage payments of between 25% and 40% of the local salary
- 255 have average mortgage payments of more than 40% of the local salary
Where does your local area fall?
Key findings
- Across the UK, the typical homeowner spends 50.9% of their income on mortgage payments.
- Kensington and Chelsea is the least affordable place to own a home, with annual mortgage repayments of £70,595 – equivalent to almost 172% of the average local salary.
- Inverclyde is the most affordable, where repayments of £5,895 a year amount to just 20% of local earnings.
- Nine of the 10 least affordable areas are in London, where house prices remain out of reach compared to average wages.
- The most affordable regions are concentrated in Scotland and the North of England, where salaries go further against lower property prices.
- Over half of Brits (54%) believe spending 25% to 35% of their income on mortgage repayments is reasonable, while three in 10 (30%) think it should be below 25%.
- Among those who don’t currently have a mortgage, 71% believe getting one in the near future is realistic, while 29% say it doesn’t feel achievable right now.
The UK areas where homeowners spend the most on their mortgage
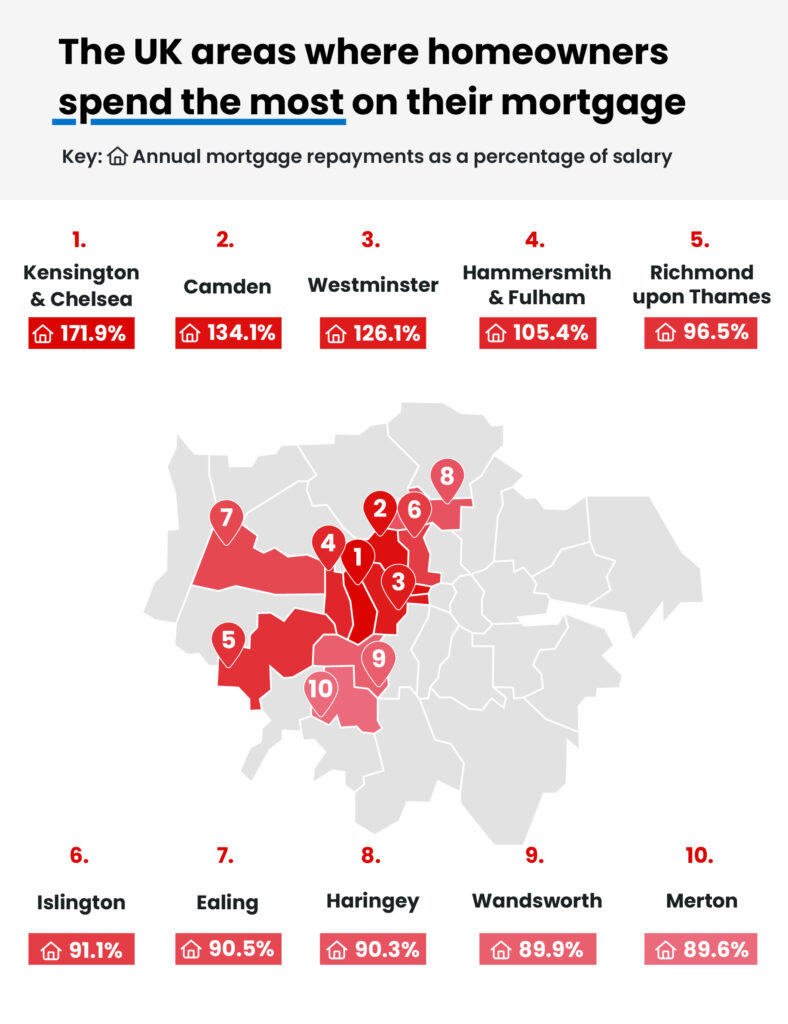
Buying a home in London has always been expensive, but these figures show just how extreme the gap has become. Just one of the top 10 places with the highest mortgage burdens falls outside of the capital.
In several boroughs, the average homeowner would need to spend their entire annual salary – and then some – just to cover a year’s mortgage repayments.
| Rank | Area | Median annual net pay | Average house price | Average deposit (20% of house value) | Average mortgage size (80% of house value) | Average annual mortgage repayment | Annual mortgage repayments as a percentage of salary | Mortgage burden |
| 1 | Kensington and Chelsea | £41,078 | £1,361,643 | £272,329 | £1,089,314 | £70,595.38 | 171.9% | High |
| 2 | Camden | £35,580 | £920,087 | £184,017 | £736,070 | £47,702.58 | 134.1% | High |
| 3 | Westminster | £40,157 | £976,519 | £195,304 | £781,215 | £50,628.34 | 126.1% | High |
| 4 | Hammersmith and Fulham | £38,442 | £781,726 | £156,345 | £625,381 | £40,529.16 | 105.4% | High |
| 5 | Richmond upon Thames | £43,065 | £801,172 | £160,234 | £640,938 | £41,537.35 | 96.5% | High |
| 6 | Elmbridge | £39,675 | £737,718 | £147,544 | £590,174 | £38,247.53 | 96.4% | High |
| 7 | Islington | £38,934 | £684,163 | £136,833 | £547,330 | £35,470.93 | 91.1% | High |
| 8 | Ealing | £33,256 | £580,477 | £116,095 | £464,382 | £30,095.25 | 90.5% | High |
| 9 | Haringey | £35,709 | £621,866 | £124,373 | £497,493 | £32,241.10 | 90.3% | High |
| 10 | Wandsworth | £39,842 | £691,050 | £138,210 | £552,840 | £35,827.99 | 89.9% | High |
- Kensington and Chelsea – mortgage payments take up 171.9% of salary
Kensington and Chelsea is officially the most expensive place to own a home in the UK. With an average property price of £1.36 million, typical annual repayments sit at £70,595, which is nearly 172% of the average salary of £41,078.
That means the average homeowner would need to spend more than three times the national average (50.9%) of their salary just to cover a year’s mortgage repayments.
The average person in Kensington and Chelsea would need to earn almost double their current income just to cover the mortgage, and even with two full local salaries, repayments would take up almost the entire household income.
- Camden – mortgage payments take up 134.1% of salary
In second place is Camden, where annual repayments of £47,703 equal 134% of the average salary (£35,580). Despite being home to some of London’s most desirable streets, Camden’s mix of heritage homes and central location drives prices well above what most residents can comfortably afford.
Even those with higher-than-average incomes would need to dedicate more than their entire year’s salary to meet repayments, placing this area firmly in the “overstretched” category. It means the typical Camden homeowner spends almost three times the UK average share of income on their mortgage.
- Westminster – mortgage payments take up 126.1% of salary
Westminster follows closely behind, with homeowners typically spending £50,628 a year on mortgage payments – about 126% of the local average salary (£40,157).
While the typical UK homeowner spends just over half of their salary on mortgage repayments, those in Westminster are spending more than twice that. On average, they pay £34,500 more each year than homeowners across the rest of the UK.
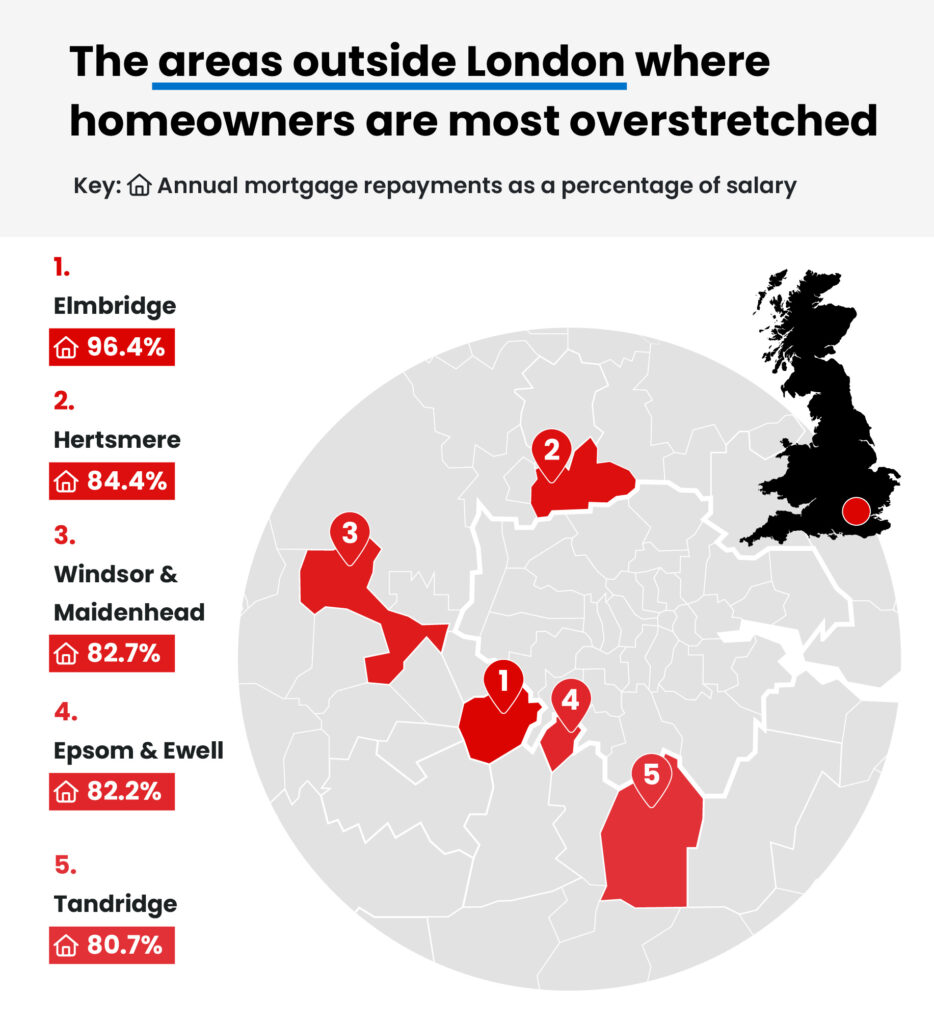
The areas outside London where homeowners are most overstretched
The affordability struggle isn’t limited to the capital. Several areas in the South East are also feeling the strain, with mortgage repayments swallowing close to or even matching local salaries.
| Rank | Area | Median annual net pay | Average house price | Average deposit (20% of house value) | Average mortgage size (80% of house value) | Average annual mortgage repayment | Annual mortgage repayments as a percentage of salary | Mortgage burden |
| 1 | Elmbridge | £39,675 | £737,718 | £147,544 | £590,174 | £38,247.53 | 96.4% | High |
| 2 | Hertsmere | £33,881 | £551,461 | £110,292 | £441,169 | £28,590.90 | 84.4% | High |
| 3 | Windsor and Maidenhead | £36,751 | £586,184 | £117,237 | £468,947 | £30,391.14 | 82.7% | High |
| 4 | Epsom and Ewell | £35,380 | £560,957 | £112,191 | £448,766 | £29,083.23 | 82.2% | High |
| 5 | Tandridge | £32,776 | £510,269 | £102,054 | £408,215 | £26,455.27 | 80.7% | High |
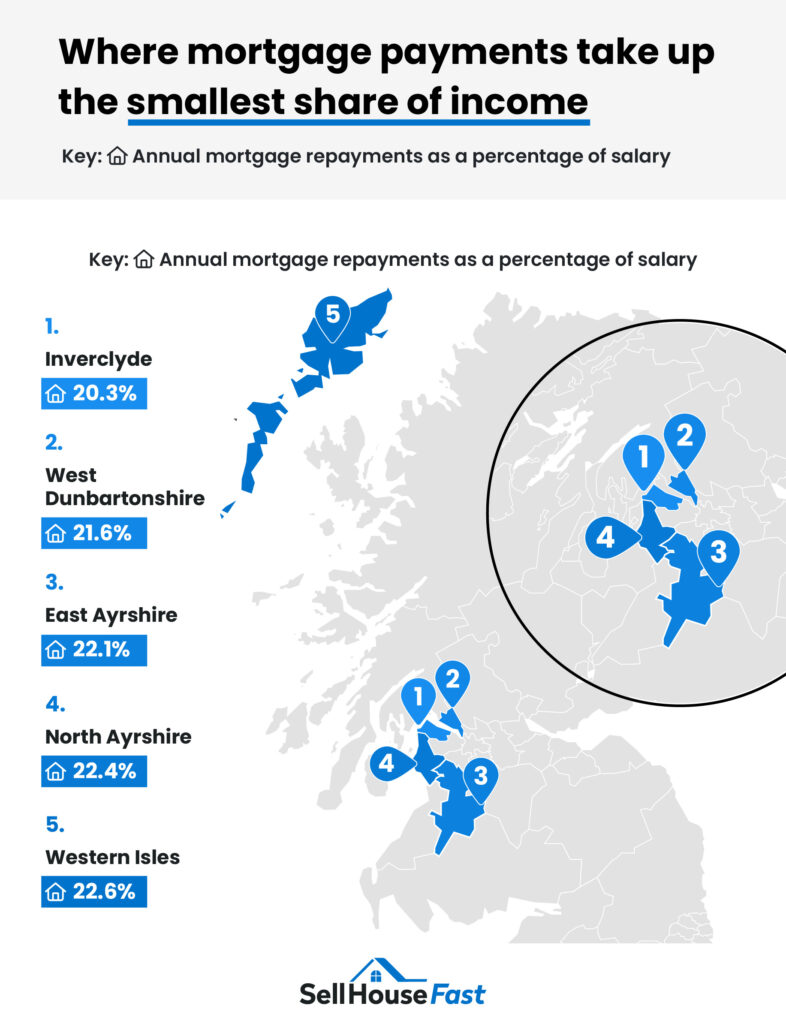
Where mortgage payments take up the smallest share of income
While some parts of the country are facing serious mortgage strain, there are still plenty of places where owning a home feels within reach.
Scotland leads the way for affordability, with several areas where mortgage repayments take up less than a quarter of the average local salary.
| Rank | Area | Median annual net pay | Average house price | Average deposit (20% of house value) | Average mortgage size (80% of house value) | Average annual mortgage repayment | Annual mortgage repayments as a percentage of salary | Mortgage burden |
| 1 | Inverclyde | £29,085 | £113,704 | £22,741 | £90,963 | £5,895.07 | 20.3% | Low |
| 2 | West Dunbartonshire | £30,042 | £124,902 | £24,980 | £99,922 | £6,475.64 | 21.6% | Low |
| 3 | East Ayrshire | £30,277 | £129,176 | £25,835 | £103,341 | £6,697.22 | 22.1% | Low |
| 4 | North Ayrshire | £30,732 | £132,811 | £26,562 | £106,249 | £6,885.68 | 22.4% | Low |
| 5 | Western Isles | £31,758 | £138,542 | £27,708 | £110,834 | £7,182.81 | 22.6% | Low |
| 6 | Aberdeen City | £30,975 | £143,204 | £28,641 | £114,563 | £7,424.52 | 24.0% | Low |
| 6 | South Ayrshire | £34,678 | £160,380 | £32,076 | £128,304 | £8,315.02 | 24.0% | Low |
| 8 | Burnley | £26,381 | £124,791 | £24,958 | £99,833 | £6,469.88 | 24.5% | Low |
| 9 | North Lanarkshire | £31,215 | £151,631 | £30,326 | £121,305 | £7,861.42 | 25.2% | Medium |
| 10 | Hyndburn | £26,516 | £129,465 | £25,893 | £103,572 | £6,712.21 | 25.3% | Medium |
- Inverclyde – mortgage payments take up 20.3% of salary
Inverclyde claims the title of the UK’s most affordable area for homeowners. This area’s coastal towns, like Greenock and Gourock, offer affordable living within commuting distance of Glasgow. Here, annual repayments average just £5,895, which works out to 20% of the typical local salary (£29,085).
That’s eight times less than what homeowners in Kensington and Chelsea spend, and the average house price here (£113,704) is nearly 12 times lower than in the London borough’s £1.36 million market.
- West Dunbartonshire – mortgage payments take up 21.6% of salary
Next is West Dunbartonshire, where the average mortgage repayment totals £6,476 per year, or almost 22% of the local income (£30,042). This could be just over a tenth of each average salary for a joint-income household.
Located north-west of Glasgow, this area has an average house price of £124,902. This means homes cost roughly the same as a 10% deposit in parts of London, or less than half the UK average (£310,953).
- East Ayrshire – mortgage payments take up 22.1% of salary
Finishing the top three is East Ayrshire, another location in Scotland, where mortgage repayments take up less than half the share of income seen across the UK.
Homeowners spend £6,697 a year on their mortgage, which is roughly 22% of the average salary seen in the area (£30,277). Even on a single income, repayments stay manageable, and for many dual-income households, that figure would fall around 11% each.
What’s a reasonable percentage of income to spend on mortgage payments?
Everyone has their own idea of what “affordable” means, but most agree that a mortgage shouldn’t take up too much of your salary.
To find out what people really think is reasonable, we asked a sample of UK residents about how much of their income they believe should go towards monthly repayments.
| What do you think is a reasonable percentage of your gross income to spend on mortgage payments? | |
| Under 25% of income | 30% |
| Around 25% to 35% | 54% |
| Around 35% to 45% | 16% |
| Over 45% | 0% |
Over half of respondents (54%) said the right balance is spending between 25% and 35% of their income, while three in ten (30%) think it should be less than 25%. For most people, that’s the sweet spot. Enough to comfortably manage repayments without feeling restricted by them.
Almost no one feels comfortable stretching beyond that point. Just 16% of people said paying 35% to 45% of their income would still feel reasonable, and none said they’d consider spending over 45% affordable.
| If you don’t have a mortgage, do you think obtaining one in the near future would be realistic? | |
| Yes | 71% |
| No | 29% |
Even with affordability pressures, most people haven’t given up on owning a home. Among those who don’t currently have a mortgage, 71% said they believe getting one in the near future is realistic, while 29% said it feels out of reach for now.
This means that roughly seven in 10 people who don’t yet own a home still expect to buy one in the coming years, while almost three in 10 do not see that happening anytime soon.
How to tell if your mortgage is becoming unaffordable
Jack Malnick, Managing Director at Sell House Fast, shares his advice on recognising when your mortgage repayments are putting too much strain on your finances:
“A mortgage should feel like a long-term investment, not a monthly source of stress. If your repayments are eating up more than 30% of your income, that’s often a sign you’re overextended.
“When essential expenses like food, bills, or savings start slipping, it’s time to reassess – whether that’s by switching to a better deal, adjusting your budget, or exploring a quicker sale if you’re really struggling.
“At Sell House Fast, we speak to homeowners every day who are feeling the pressure of rising costs and uncertain interest rates. For some, selling on the open market isn’t an option because of the time or stress involved. That’s where a fast cash sale can help people regain control of their finances and move forward with peace of mind.
“The key thing to remember is that there’s always a way through. Whether you’re looking to remortgage or sell up entirely, it’s important to take action early before the situation becomes overwhelming.”
Methodology
Sell House Fast is a leading UK cash house buyer, helping homeowners secure a guaranteed property sale without the delays or uncertainty of the traditional market. By purchasing directly for cash, we make it possible to complete a sale in as little as seven days, offering a simple and stress-free alternative for those who need to move quickly or manage financial pressures.
Because affordability plays such a crucial role in people’s ability to buy, sell, and stay in their homes, we wanted to understand where homeowners are feeling the greatest strain from rising mortgage costs.
To do this, we calculated the average house price for all types of property within each local authority using official government house price data.
We then took official ONS figures for the median annual gross income by local authority.
To calculate net income, we subtracted the standard personal allowance and national insurance. Note: No pension or student loan adjustments were taken into consideration.
For the mortgage repayment figures, we made the following assumptions:
- Mortgage type: New fixed rate
- Interest rate: 4.22% (taken from August 2025 figures from the Bank of England)
- Deposit: 20%
- Loan-to-value (LTV): 80%
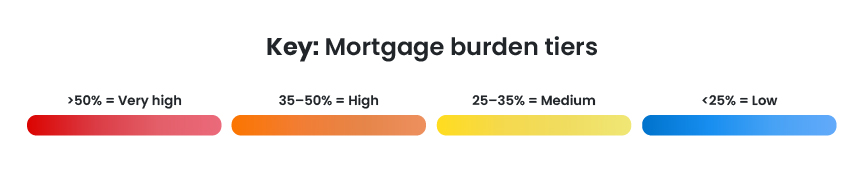
Each local authority was then assigned a burden threshold based on the annual mortgage repayments as a percentage of net annual pay:
- <25% = Low
- 25–40% = Medium
- >40% = High
All data was collected in October 2025 and is correct as of then.