Nuisance Neighbours: Where are the Best and Worst Neighbours in England?
Buying and selling a house partly involves the property, but the surrounding community can be equally important. Noisy, antisocial, or disruptive neighbours can make everyday life uncomfortable and affect the ease of selling your home.
For homeowners facing these challenges, cash house buyers can provide a faster way to move forward, avoiding the delays and uncertainty of the open market.
We reveal where in England you’re most likely to find peaceful neighbours and where antisocial behaviour might be more prevalent.
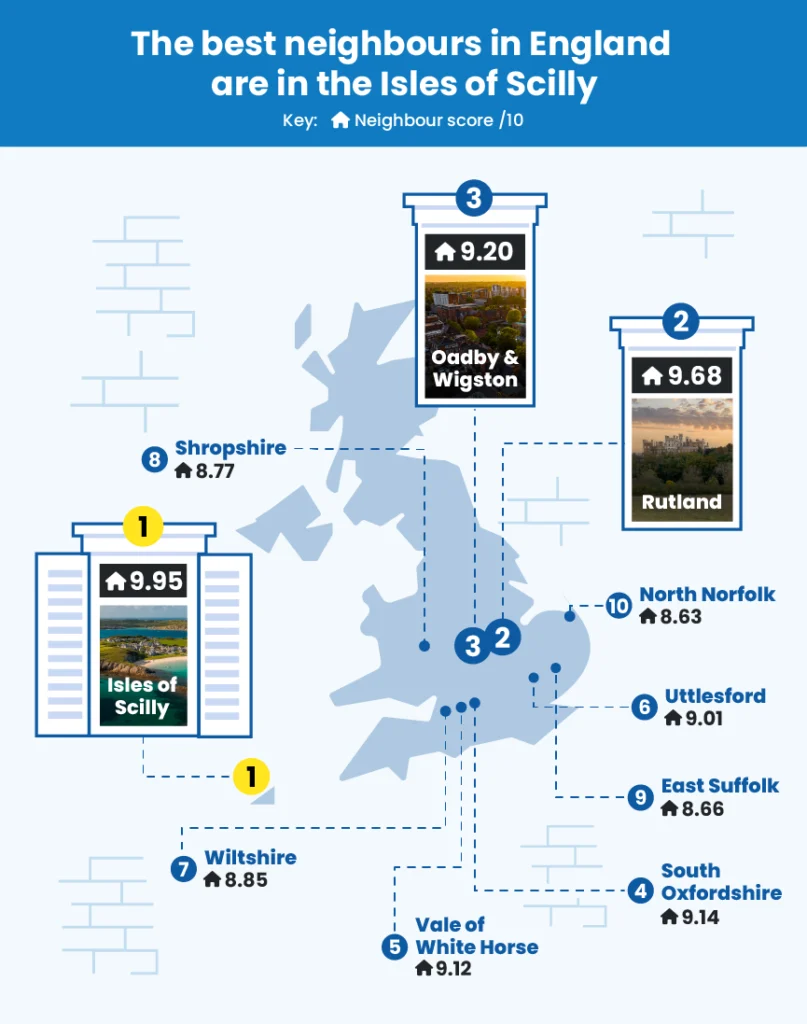
The best neighbours in England are in the Isles of Scilly
Where you live can significantly impact how troublesome your neighbours are. We analysed the following to identify the areas in England with the best neighbours:
- Crime rates
- antisocial behaviour
- Noise complaints and
- Fly-tipping incidents
The top-ranking areas performed best overall out of all the above categories.
| Rank | Local authority | Political control | Crime rate per 1,000 people | Monthly antisocial behaviour offences per 1,000 people | Noise complaints per 1,000 people | Fly tipping incidents per 1,000 people | Neighbour score /10 |
| 1 | Isles of Scilly | IND | 28.1 | 0.42 | 0.0 | 9.95 | |
| 2 | Rutland | LDM+GRN (minority) | 39.2 | 0.51 | 1.7 | 3.0 | 9.68 |
| 3 | Oadby and Wigston | LDM | 60.0 | 0.57 | 1.6 | 0.2 | 9.20 |
| 4 | South Oxfordshire | LDM | 42.7 | 0.68 | 2.0 | 5.7 | 9.14 |
| 5 | Vale of White Horse | LDM | 48.1 | 0.76 | 2.4 | 3.0 | 9.12 |
| 6 | Uttlesford | IND | 54.1 | 0.78 | 2.1 | 3.5 | 9.01 |
| 7 | Wiltshire | LDM+IND | 47.3 | 1.06 | 0.9 | 5.4 | 8.85 |
| 8 | Shropshire | LDM | 49.9 | 0.95 | 2.5 | 3.6 | 8.77 |
| 9 | East Suffolk | NOC | 51.6 | 0.57 | 2.4 | 7.4 | 8.66 |
| 10 | North Norfolk | LDM | 41.2 | 0.54 | 4.3 | 3.4 | 8.63 |
1. Isles of Scilly | Neighbour score: 9.95/10
The least troubling neighbours in England can be found in the Isles of Scilly, scoring 9.95 out of 10. The area has the lowest crime rate, at just 28.1 per 1,000 people. The highest reported crime type for the year ending March 2025 was violence against the person. There were just 10 recorded instances per 1,000 people of this crime, which can include harassment and common assault.
There were just 0.42 monthly antisocial behaviour offences per 1,000 people, fewer than in all but five of the locations we examined.
2. Rutland | Neighbour score: 9.68/10
Rutland is home to some of the most peaceful neighbours in England, with a score of 9.68 out of 10. It has one of the lowest crime rates out of all areas we looked at, with 39.2 incidents per 1,000 people for the year ending March 2025. Like in the Isles of Scilly, the most common crime was violence against the person, at 15 incidents per 1,000 people.
Rutland also has one of the lowest monthly rates of antisocial behaviour (0.51), noise complaints (1.7), and fly-tipping (3.0) incidents per 1,000 population. There were also no evictions due to antisocial behaviour in the last year.
With an average house price of £336,086, slightly above the UK average of £291,000, Rutland’s peaceful setting and low antisocial behaviour contribute to its high home value. Buyers in this area are investing in a calmer lifestyle.
3. Oadby and Wigston | Neighbour score: 9.20/10
The Leicestershire area of Oadby and Wigston is one of the best places to live for hassle-free neighbours. There were just 0.57 monthly reports of antisocial behaviour per 1,000 people, which can include cases of vandalism or graffiti.
Oadby and Wigston had just 1.6 noise complaints per 1,000 people, making the area among the quietest in England, and 0.2 fly tipping incidents per 1,000, lower than all areas except the Isles of Scilly.
Homes in Oadby and Wigston sit below the national average, at £260,586, offering good value given the area’s peaceful neighbours. The affordability and quiet environment make it especially appealing to buyers.
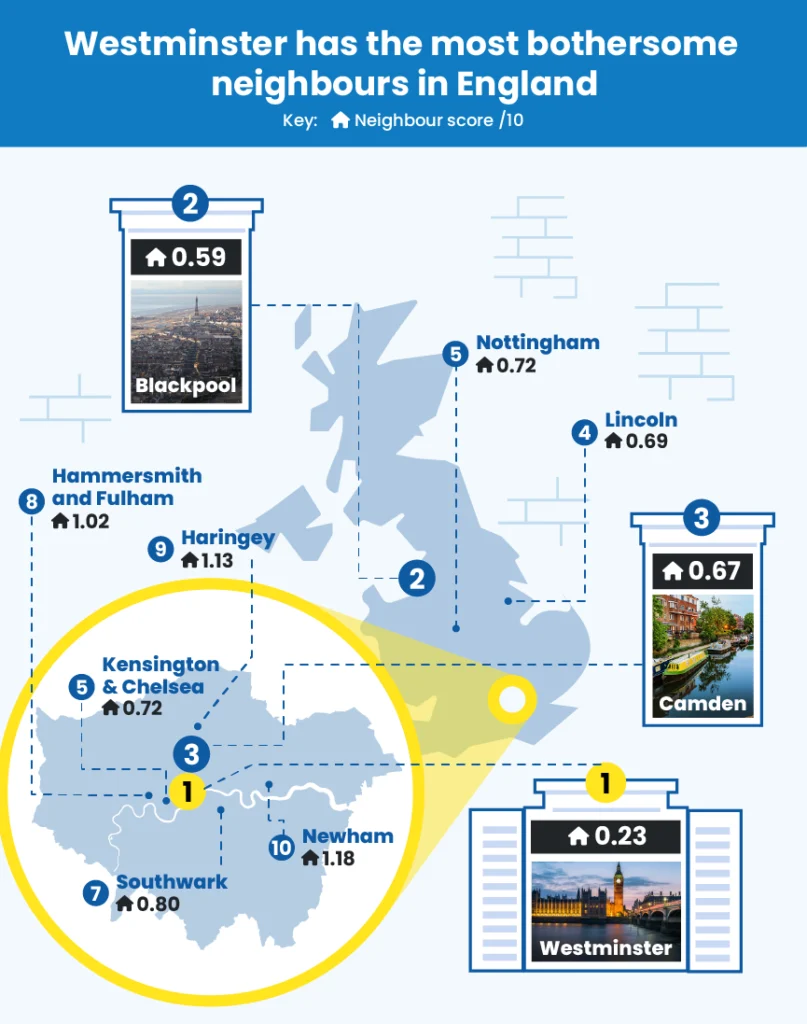
Westminster has the most bothersome neighbours in England
While some areas are known for having peaceful neighbours, others have a bigger reputation for antisocial behaviour.
| Rank | Local authority | Political control | Crime rate per 1,000 people | Monthly antisocial behaviour offences per 1,000 people | Noise complaints per 1,000 people | Fly tipping incidents per 1,000 people | Evictions due to antisocial behaviour per 100,000 people | Neighbour score /10 |
| 1 | Westminster | LAB | 423.2 | 5.98 | 68.1 | 120.7 | 1.43 | 0.23 |
| 2 | Blackpool | LAB | 154.4 | 5.39 | 17.5 | 37.6 | 1.39 | 0.59 |
| 3 | Camden | LAB | 194.8 | 4.27 | 23.8 | 157.5 | 0.46 | 0.67 |
| 4 | Lincoln | LAB | 124.3 | 3.53 | 11.1 | 25.8 | 2.85 | 0.69 |
| 5 | Kensington and Chelsea | CON | 154.2 | 3.22 | 65.3 | 48.5 | 0.69 | 0.72 |
| 5 | Nottingham | LAB | 118.4 | 2.17 | 21.3 | 92.7 | 1.81 | 0.72 |
| 7 | Southwark | LAB | 127.6 | 3.04 | 26.1 | 72.6 | 0.64 | 0.80 |
| 8 | Hammersmith and Fulham | LAB | 113.6 | 2.76 | 64.5 | 63.8 | 0.53 | 1.02 |
| 9 | Haringey | LAB | 107.3 | 3.07 | 29.9 | 62.8 | 0.38 | 1.13 |
| 10 | Newham | LAB | 112.2 | 2.63 | 17.9 | 54.1 | 0.53 | 1.18 |
1. Westminster | Neighbour score: 0.23/10
Westminster has the most annoying neighbours in England, scoring 0.23 out of 10. It has the highest crime rate at 423.2 crimes per 1,000 people in the year ending March 2025, with standout crimes including theft offences, of which there were 307 per 1,000. Despite this, there were just six instances of residential burglary per 1,000 people, although over half (152) of theft offences were categorised as theft from the person. Since the area is at the heart of London and home to many tourist attractions and busy shopping streets, offences like theft can reflect tourist activity in addition to residential disputes.
Westminster also has the highest monthly rate of antisocial behaviour offences (5.98) and the most noise complaints (68.1) per 1,000 population. Fly-tipping incidents are the fourth-highest in the country, at 120.7 per 1,000 people. The high rate of antisocial behaviour in the area, particularly fly-tipping and crime, can make it difficult to sell houses in Westminster.
Westminster is home to high property prices, at £1,035,323 on average, despite ranking worst for neighbour troubles. Its high property prices, despite the high levels of antisocial behaviour, indicate that the convenient central London location outweighs local nuisance factors.
2. Blackpool | Neighbour score: 0.59/10
Blackpool has some of the most antisocial neighbours in England, scoring 0.59 out of 10. It is home to the fifth-highest crime rate, at 154.4 reported crimes per 1,000 people in the year ending March 2025, of which 69 were recorded as violence against the person.
The area also had 5.39 monthly antisocial behaviour offences per 1,000 people. In the last year, there were also 17.5 noise complaints and 37.6 fly tipping incidents per 1,000 people.
Blackpool has some of the lowest average house prices in the country, at £129,356. This reflects economic conditions, including the state of industry and employment, and the challenges of antisocial behaviour in the area. It is an affordable option for buyers on a strict budget. Prices sit around £161,644 below the national average, indicating it is difficult to sell homes at a higher price. Properties listed closer to the national average tend to struggle on the market, often taking longer to sell, which keeps average prices lower.
3. Camden | Neighbour score: 0.67/10
Camden residents suffer from some of the most antisocial neighbourhoods in the country, scoring 0.67 out of 10. It is home to the second-highest crime rate, second to Westminster, at 194.8 reported incidents per 1,000 people in the last 12 months.
There are also 4.27 monthly antisocial behaviour offences per 1,000 people, making Camden the third worst in England for this. Fly-tipping incidents are reported at 157.5 per 1,000 people in a year, which could deter potential buyers.
Despite Camden’s poor neighbour score, property prices remain high, at £876,065 compared to the £291,000 national average, due to strong demand and its central London location. Buyers are paying for connectivity even if it comes at the cost of more disruptive neighbours.
How does political leadership shape antisocial behaviour?
Local councils and political control can directly influence neighbours’ social behaviour. Policies on issues such as noise, fly-tipping, crime prevention, and antisocial behaviour can impact community behaviour. For example, Labour’s Crime and Policing Bill implements Respect Orders that make it easier to take quicker action against repeat antisocial offenders. It also allows ministers to officially guide councils on fly-tipping enforcement. The political control of the best and worst neighbour areas demonstrates how leadership style can shape liveability.
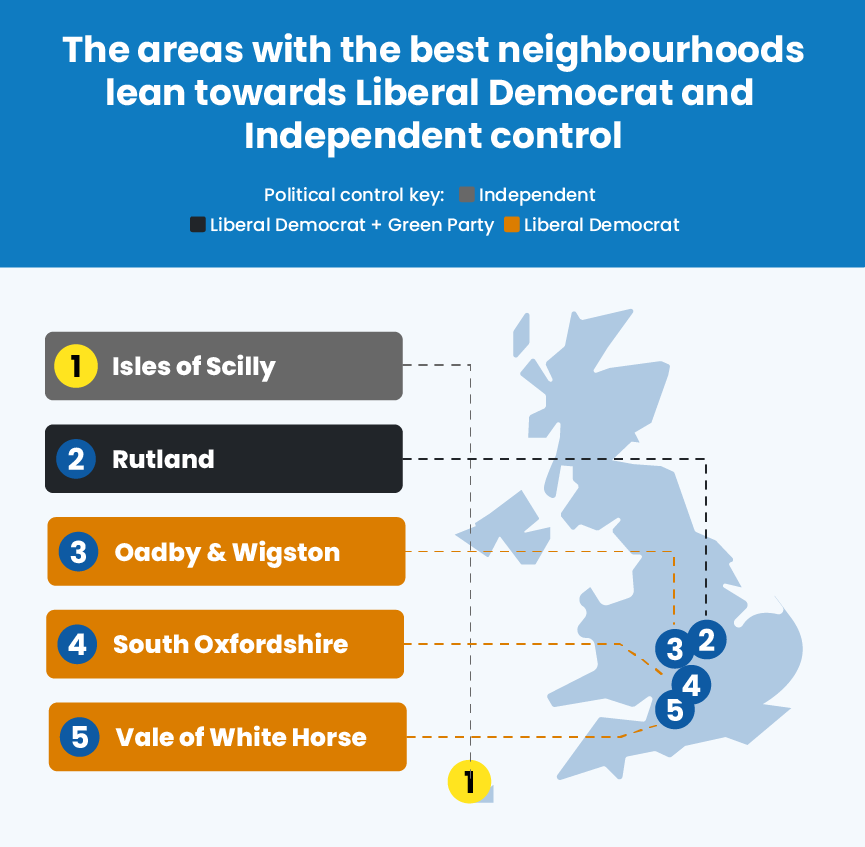
The areas with the best neighbourhoods lean towards Liberal Democrat and Independent control
| Rank | Local authority | Political control |
| 1 | Isles of Scilly | IND |
| 2 | Rutland | LDM+GRN (minority) |
| 3 | Oadby and Wigston | LDM |
| 4 | South Oxfordshire | LDM |
| 5 | Vale of White Horse | LDM |
The five highest-scoring neighbour areas lean towards liberal democrat, independent, and Green Party control.
In Rutland, councillors value resident feedback, recently replacing the Fix My Street portal with a more responsive tool that addresses reports like fly-tipping and potholes.
Oadby & Wigston’s Liberal Democrat council enforces untidy land notices under section 215 of the Town and Country Planning Act, serving legal notices for neglected properties or fly-tipped sites.
Meanwhile, South Oxfordshire and the Vale of White Horse are working with police and local partners through a Community Safety Partnership scheme. This aims to install increased CCTV and run a youth programme to reduce antisocial behaviour.
These local strategies lead to cleaner and safer communities, which impacts property desirability. In these areas, homes often sell quickly and at higher prices.
Four out of five of the areas with the worst neighbours are Labour-controlled
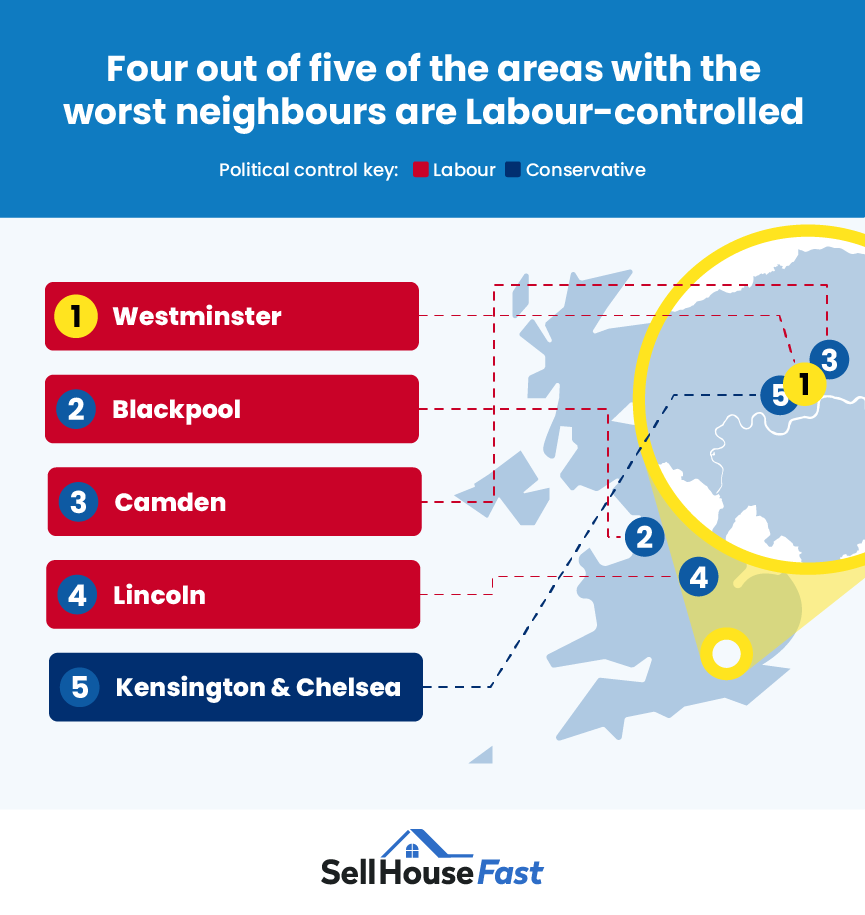
| Rank | Local authority | Political control |
| 1 | Westminster | LAB |
| 2 | Blackpool | LAB |
| 3 | Camden | LAB |
| 4 | Lincoln | LAB |
| 5 | Kensington and Chelsea | CON |
The areas with the most antisocial neighbours are all Labour-controlled, except for Kensington and Chelsea. In these areas, high rates of crime, noise complaints, and fly-tipping indicate that enforcement of antisocial behavioural policies may be inconsistent. Many of these areas are in London, where large populations can mean council resources are spread thin.
Homeowners and sellers may find selling their homes trickier in these areas. Properties often face an extended amount of time on the market, price reductions, or needing to attract investor or cash-buyer interest instead of traditional house buyers. Using a house-selling company like Sell House Fast can make it easier to sell your home, no matter where it is, with fast, high-value sales prioritised.
Jack Malnick, Managing Director of Sell House Fast, comments on future expectations of the UK housing market:
“Selling a property often comes with challenges, but the process can become difficult when that property is in a nuisance neighbourhood. Demand for affordable housing is expected to remain strong across the UK, meaning homes in less desirable areas will still find buyers. However, they may face lower asking prices, longer selling times, and more frequent price negotiations. Despite this, these properties still appeal to first-time buyers looking to get on the property ladder and prioritising budget over location.
“In the coming months and years, alternative selling routes are anticipated to grow in popularity. Cash buyers and rental-first strategies will become more common as homeowners seek flexibility and relief in tougher markets. Sellers may also need to adjust their expectations regarding time on the market and final sale prices.
“For homeowners struggling to sell in nuisance neighbourhoods, quick-sale companies can bring results where time is critical. Regardless of your location, organisations like Sell House Fast can help reposition the property towards investors, which can bring a quicker sale. In other cases, waiting until neighbourhood conditions improve may be more profitable.”
Methodology
Sell House Fast is a leading UK cash house buyer, helping homeowners secure a guaranteed property sale without the delays of the traditional estate agent route. By purchasing directly for cash and handling the entire process, we offer a stress-free alternative that can be completed in as little as seven days.
As property values are shaped not just by bricks and mortar but also by the environments people live in, we wanted to see which local authorities in England offer the best and worst conditions for homeowners. To do this, we analysed the following data:
1. Crime rate: the crime rate per 1,000 people, sourced from the Office for National Statistics Crime in England and Wales: Police Force Area data tables
2. antisocial behaviour: the monthly rate of antisocial behaviour offences per 1,000 people, sourced from LG Inform
3. Noise complaints: the rate of noise complaints per 1,000 people, sourced from Public Health England Fingertips data
4. Fly tipping: the rate of fly tipping incidents per 1,000 people, sourced from the Department for Environment, Food & Rural Affairs’ fly-tipping statistics for England
5. antisocial behaviour evictions: The rate of evictions due to antisocial behaviour per 100,000 people, sourced from the Ministry of Housing, Communities and Local Government’s Local Authority Housing Statistics data returns for 2023 to 2024
If an area was missing data for a factor, its overall score was calculated based on an average of the remaining factors.
The following councils have recently been formed from the merging of smaller authorities. In any cases where data was only presented for these older, smaller authorities, the figures were averaged to create a figure for the newer, merged authority:
– East Suffolk
– Buckinghamshire
– North Northamptonshire
– West Northamptonshire
– Westmorland & Furness
– Cumberland
House prices were sourced using the HM Land Registry House Price Index for June 2025.