Buyer Beware: England’s Riskiest Areas To Buy and Sell Property
North East Lincolnshire is England’s riskiest place to buy and sell property, scoring 8.15 out of 10 in a new analysis of 152 areas – nearly double the average of 4.47.
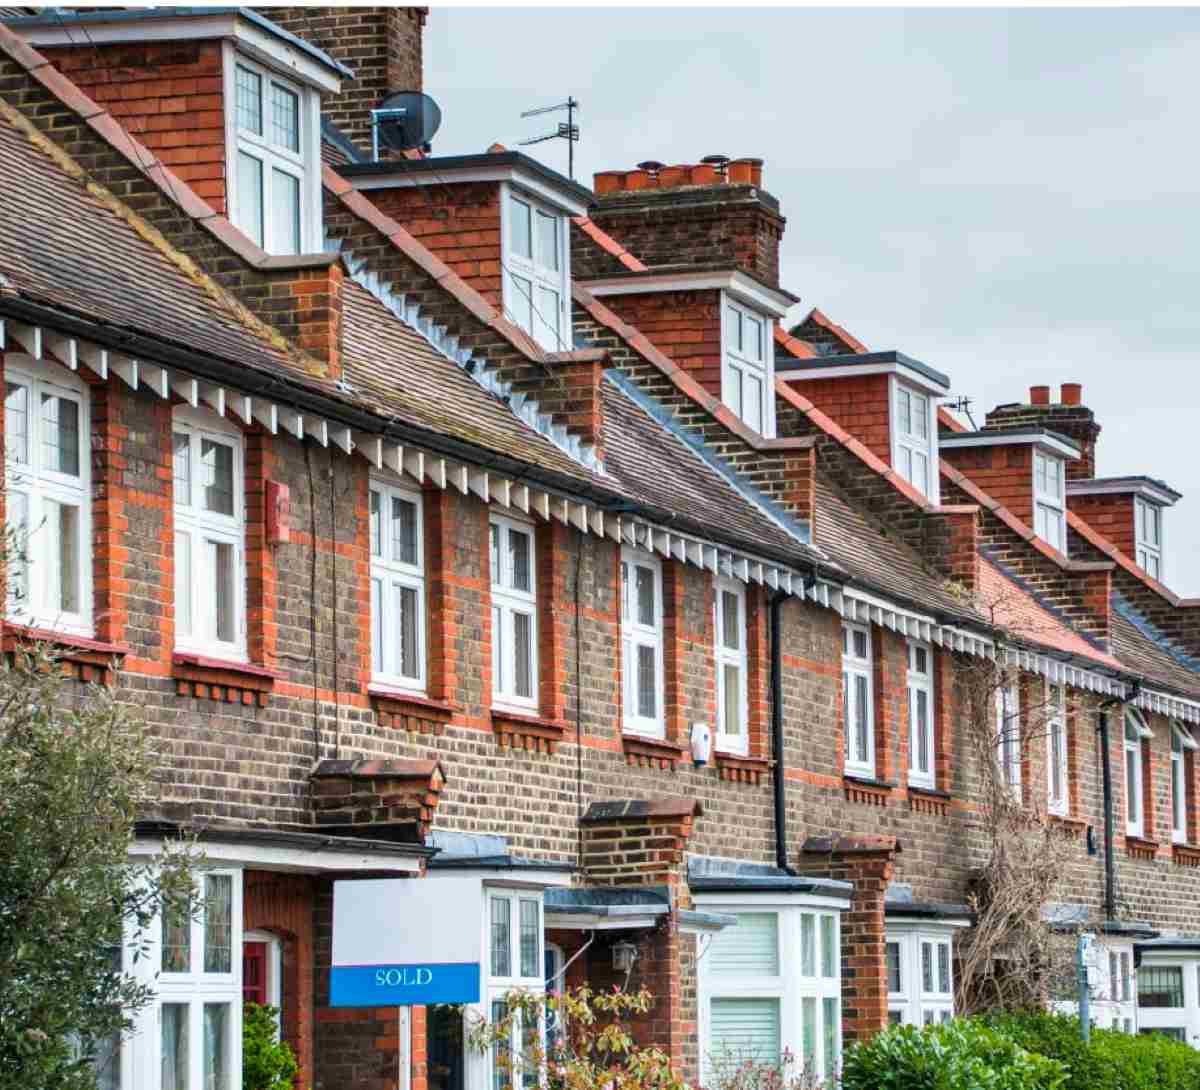
Buying or selling a home usually starts with price, demand, and location. But those headline factors rarely tell the full story. Alongside them sit a wider set of risks that can shape how attractive an area feels to buyers, how easy a home is to insure, and how straightforward a sale may be when the time comes.
This study compares 152 English areas across five measures that can affect day-to-day living and long-term property appeal:
- Recorded crime
- Flood risk
- Air pollution
- Road collisions
- Coastal erosion
These findings have practical implications for homeowners: properties in higher-risk areas may face longer selling times, more aggressive price negotiations, and a smaller pool of confident buyers.
| Selling in a higher-risk area? If local risk factors are likely to make a sale more difficult to navigate, it can be worth understanding all your options early. For some homeowners, that may include speaking with Sell House Fast or exploring whether cash house buyers could offer a more certain route, especially if speed, simplicity, and reducing the risk of a sale falling through are high priorities. |
Key findings
- North East Lincolnshire is England’s riskiest area overall, with a score of 8.15 out of 10, well above the study average of 4.47.
- At the other end of the ranking, Rutland is England’s lowest-risk area overall, with a score of 1.17 out of 10.
- Kingston upon Hull has the highest flood exposure in the study, with 16.8% of properties at high risk.
- Westminster records the highest crime rate, at 410.1 crimes per 1,000 people.
- Hackney has the highest road collision rate, with 2,646 collisions per billion vehicle miles.
- Blackpool has the highest mainland coastal erosion danger, with 6.92% of properties at risk.
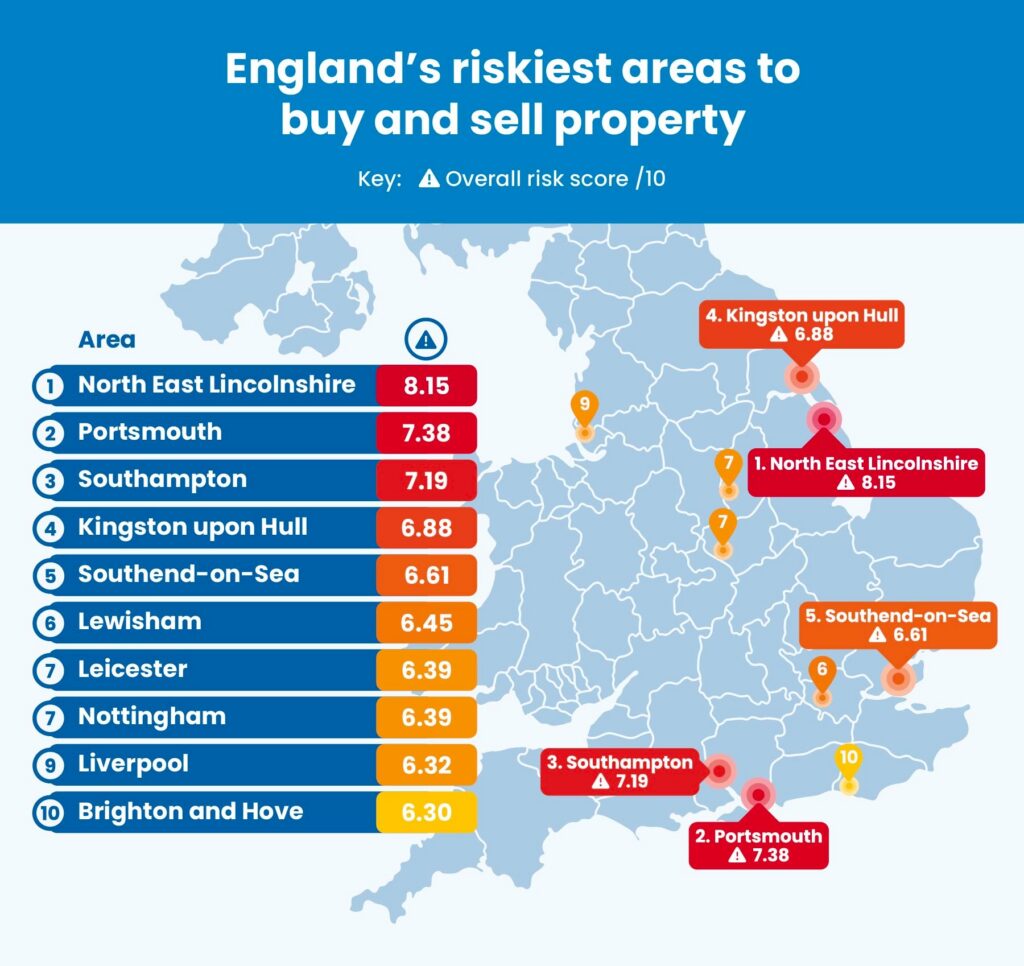
North East Lincolnshire is England’s riskiest place to buy and sell property
North East Lincolnshire could be the hardest place to own a home, with Portsmouth and Southampton close behind in a ranking based on crime, flood risk, air pollution, road collisions, and coastal erosion.
Across England, the average area records 87.9 crimes per 1,000 people, 2.6% of properties at high flood risk, air pollution levels of 7.0, 534.3 road collisions per billion vehicle miles, and 0.35% of homes exposed to coastal erosion.
But the places at the top of the ranking keep appearing on the wrong side of those figures, revealing where buyers and sellers may face the greatest level of uncertainty.
| Rank | Area | Recorded crime (per 1,000 people) | Properties at high flood risk | Air pollution level (PM2.5) | Road collisions (per billion vehicle miles) | Properties at risk of coastal erosion | Overall risk score /10 |
| 1 | North East Lincolnshire | 116.7 | 6.8% | 7.3 | 583 | 0.8% | 8.15 |
| 2 | Portsmouth | 114.3 | 4.4% | 6.6 | 605 | 0.2% | 7.38 |
| 3 | Southampton | 120.9 | 2.1% | 6.5 | 754 | 0.9% | 7.19 |
| 4 | Kingston upon Hull | 118.9 | 16.8% | 7.4 | 833 | 0.0% | 6.88 |
| 5 | Southend-on-Sea | 94.4 | 0.9% | 7.3 | 699 | 1.1% | 6.61 |
| 6 | Lewisham | 94.4 | 2.8% | 9.0 | 1,631 | 0.0% | 6.45 |
| 7 | Leicester | 111.6 | 6.2% | 7.9 | 438 | 0.0% | 6.39 |
| 7 | Nottingham | 120.8 | 3.0% | 7.7 | 711 | 0.0% | 6.39 |
| 9 | Liverpool | 121.6 | 0.7% | 6.7 | 617 | 0.3% | 6.32 |
| 10 | Brighton and Hove | 104.8 | 0.8% | 6.7 | 715 | 0.7% | 6.30 |
1. North East Lincolnshire is pulled down by risk on almost every front
North East Lincolnshire ranks as England’s riskiest place to buy and sell property, with an overall score of 8.15 out of 10.
What pushes it to the top is the sheer number of warning signs:
- Crime stands at 116.7 per 1,000 people
- Flood risk at 6.8%
- Air pollution at 7.3%
- Road collisions at 583 per billion vehicle miles
- 0.8% of homes are exposed to coastal erosion
Flooding could be one of the main dangers. The area sits on the Humber Estuary, where local flood planning focuses on risks from the sea, drainage, and surface water issues, and North East Lincolnshire Council has also highlighted the need for ongoing coastal defence work along the estuary.
2. Portsmouth pairs high crime and flood exposure with a strong overall risk score
Some places rank highly because of one especially high figure. Portsmouth is different. Its second-place finish, with a score of 7.38, is driven by a broader pattern of elevated risk.
The city records 114.3 crimes per 1,000 people, well above the national average, while 4.4% of properties are classified as high flood risk. Road collisions are also higher than the England benchmark at 605 per billion vehicle miles.
Portsmouth’s risk profile is closely tied to the realities of being a dense coastal city. The council says road traffic is the main source of nitrogen dioxide pollution in the city, accounting for around half of the city’s air pollution.2 Areas in Portsmouth, such as Farlington and Drayton, are also at risk from multiple sources of flood risk, like surface water, sewer, and tidal flooding.3
3. In Southampton, road safety and crime are among the clearest pressure points
Southampton’s third-place ranking is shaped by some of the strongest figures in the study for crime and road collisions.
The area records 120.9 crimes per 1,000 people, while road collisions climb to 754 per billion vehicle miles. Coastal erosion affects 0.9% of properties, which is also notably above the national average. Flood risk is less severe than in some of the other top-ranked areas at 2.1%, but the city still scores highly overall.
Southampton’s profile feels more tied to transport pressure than coastal exposure alone. The council’s road safety data highlights collisions as a major preventable cause of death and injury, while its latest air quality report focuses on improving air quality by reducing emissions from road transport.4
| Jack Malnick, Managing Director at Sell House Fast, outlines what this could mean for homeowners:“A higher-risk ranking does not mean homes in these areas will not sell. It does mean buyers may look more closely, ask more questions, and compare those locations more critically against lower-risk alternatives.“That is where property value and saleability come into the conversation. When several risks sit above average at once, buyers may start to factor them into what they are willing to pay and how much compromise they are prepared to accept. In a more cautious market, that can lead to longer selling periods, sharper negotiation, or a smaller pool of interested buyers.For homeowners who need a faster or more certain sale, understanding that wider backdrop matters. A property does not exist in isolation. The area around it can shape how it is judged just as much as the home itself.” |
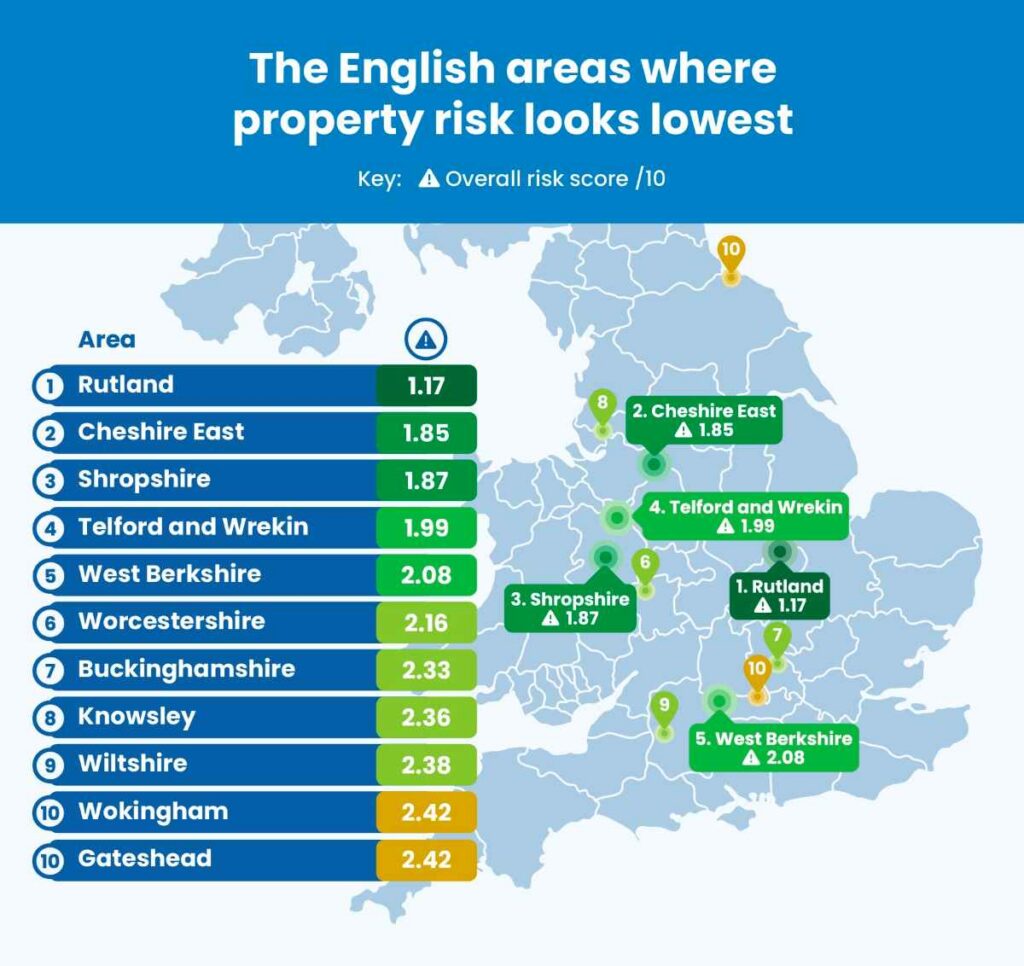
The English areas where property risk looks lowest
At the safer end of the ranking, the story is about avoiding the kinds of issues that can make buyers pause. These are the places where crime tends to be lower, serious environmental exposure is more limited, and road safety data is less alarming than elsewhere in England.
That does not make any area risk-free. But it does create an easier sell. When a location has fewer obvious warning signs in the broader data, buyers have less to worry about before they even reach the front door.
| Rank | Area | Recorded crime (per 1,000 people) | Properties at high flood risk | Air pollution level (PM2.5) | Road collisions (per billion vehicle miles) | Properties at risk of coastal erosion | Overall risk score /10 |
| 1 | Rutland | 41.5 | 0.6% | 6.6 | 75 | 0.0% | 1.17 |
| 2 | Cheshire East | 60.3 | 1.1% | 6.4 | 191 | 0.0% | 1.85 |
| 3 | Shropshire | 48.9 | 2.7% | 5.5 | 178 | 0.0% | 1.87 |
| 4 | Telford and Wrekin | 75.1 | 1.2% | 6.2 | 136 | 0.0% | 1.99 |
| 5 | West Berkshire | 56.8 | 2.4% | 6.3 | 113 | 0.0% | 2.08 |
| 6 | Worcestershire | 65.0 | 2.5% | 6.0 | 150 | 0.0% | 2.16 |
| 7 | Buckinghamshire | 53.7 | 1.7% | 7.1 | 150 | 0.0% | 2.33 |
| 7 | Knowsley | 82.0 | 0.4% | 6.8 | 180 | 0.0% | 2.36 |
| 9 | Wiltshire | 48.4 | 2.4% | 6.0 | 235 | 0.0% | 2.38 |
| 10 | Wokingham | 40.8 | 2.3% | 7.1 | 162 | 0.0% | 2.42 |
| 10 | Gateshead | 90.2 | 0.4% | 6.0 | 229 | 0.0% | 2.42 |
1. Rutland records the lowest property risk score in England
Rutland takes the lowest-risk spot in the study, helped by some of the calmest figures anywhere in the ranking. It records just 41.5 crimes per 1,000 people, a flood risk rate of 0.6%, and only 75 road collisions per billion vehicle miles, the lowest collision figure in the entire table. No homes in the dataset are flagged as being at risk of coastal erosion.
That road safety result is not a one-off. Rutland County Council’s 2024 to 2025 annual report says fatal or serious road collisions in the county have fallen by 38% in recent years, leaving Rutland with the third-lowest figure among its CIPFA nearest neighbours.5
2. Cheshire East combines lower crime with cleaner air
Cheshire East ranks second-lowest overall, with a score of 1.85 out of 10, and its data paints a reassuring picture across several of the study’s key measures:
- Crime sits at 60.3 per 1,000 people
- Flood risk is relatively low at 1.1%
- Road collisions are 191 per billion vehicle miles
- No coastal erosion exposure at all
The Safer Cheshire East Partnership says its role is to provide strategic leadership to reduce crime and reassure communities that Cheshire East is a safe place to live and work, while the latest Cheshire-wide police update says the county has retained its position as the safest place in the North West.6
3. Shropshire’s cleaner air helps keep it near the bottom of the ranking
Shropshire completes the bottom three, and one of its strongest advantages sits in a factor that does not always dominate property conversations at first glance. Its PM2.5 level is 5.5 – the lowest scores anywhere in the bottom 10 – while crime remains low at 48.9 per 1,000 people and road collisions sit at 178 per billion vehicle miles.
The latest picture of air quality helps explain why. Shropshire Council’s 2025 Air Quality Annual Status Report describes the area as predominantly rural, with air quality issues concentrated in more localised pockets such as key highway junctions and specific Air Quality Management Areas in Bridgnorth and Shrewsbury, rather than being spread widely across the county.7
Where crime could put the most pressure on local property markets
Crime is one of the most rapid risk factors shaping how an area is judged. Flood exposure, air pollution, and road safety may matter just as much in the long run, but crime tends to land first because it affects how safe a place feels before a buyer has looked at anything else.
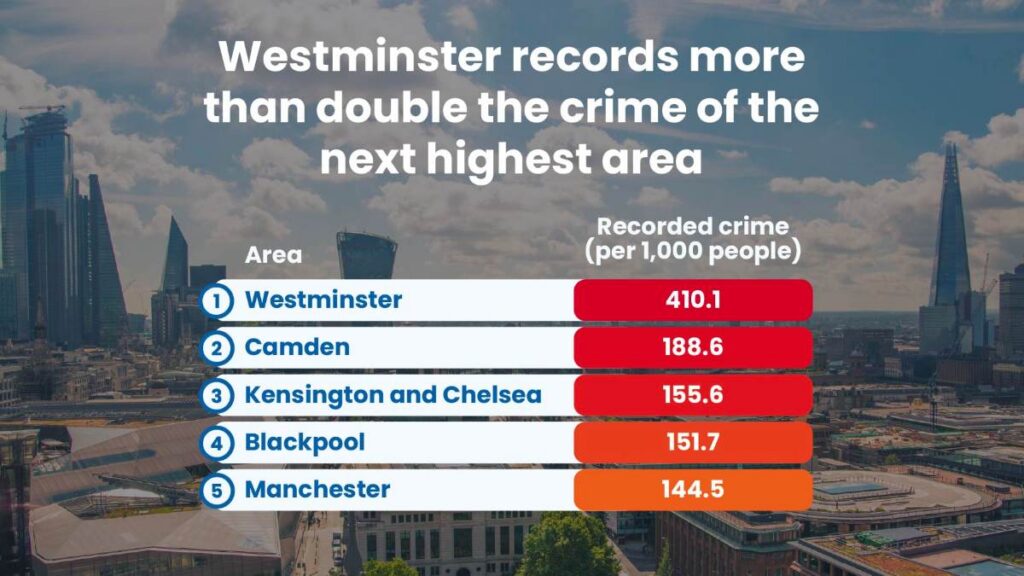
Westminster records more than double the crime compared to other UK areas
| Rank | Area | Recorded crime (per 1,000 people) |
| 1 | Westminster | 410.1 |
| 2 | Camden | 188.6 |
| 3 | Kensington and Chelsea | 155.6 |
| 4 | Blackpool | 151.7 |
| 5 | Manchester | 144.5 |
Westminster records the highest crime rate in the study at 410.1 crimes per 1,000 people, which puts it far clear of every other area in the ranking. Camden follows on 188.6, then Kensington and Chelsea on 155.6, Blackpool on 151.7, and Manchester on 144.5.
Westminster’s crime figures show more than just its resident population. As the heart of government, tourism, shopping, nightlife, and major transport links, the borough sees enormous daily footfall. Council budget papers say the borough’s daytime population can swell to a million people, compared with a resident population of 211,500.8
This creates far more opportunities for crime to be recorded than in a more typical residential area.
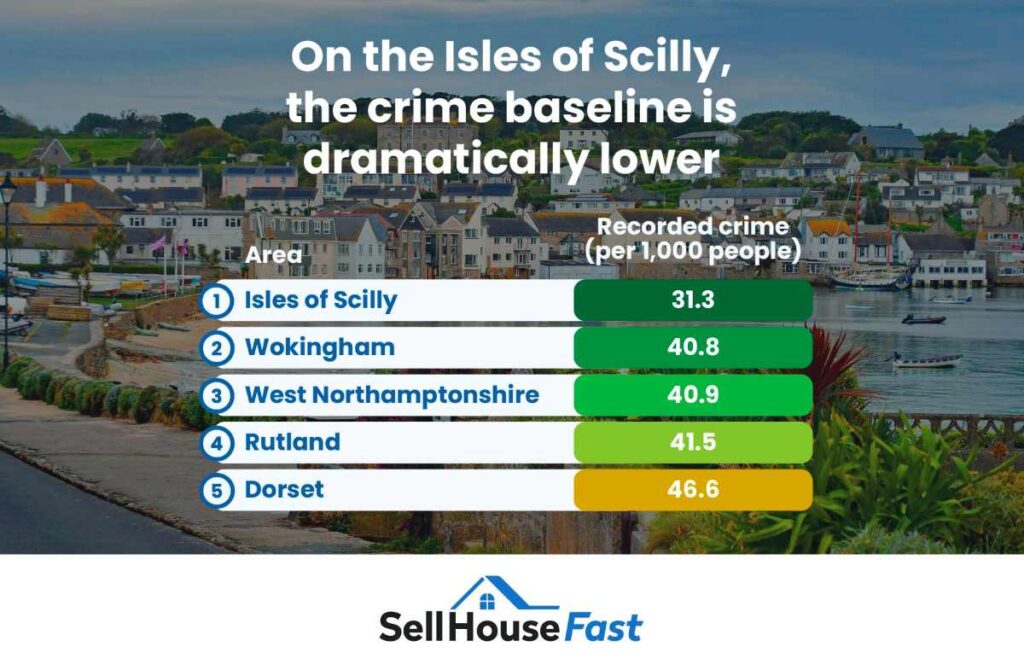
On the Isles of Scilly, the crime baseline is dramatically lower
| Rank | Area | Recorded crime (per 1,000 people) |
| 1 | Isles of Scilly | 31.3 |
| 2 | Wokingham | 40.8 |
| 3 | West Northamptonshire | 40.9 |
| 4 | Rutland | 41.5 |
| 5 | Dorset | 46.6 |
At the other end of the table, the Isles of Scilly records the lowest crime rate in the study at 31.3 per 1,000 people.
The Isles of Scilly stands out for the opposite reason to Westminster. Instead of a major urban centre attracting huge daily footfall, it is a small island authority with a resident population of around 2,300, though this rises seasonally with tourism to as much as 6,000 in peak summer.9
| Jack Malnick explains why this matters for buyers and sellers: “For buyers, crime often shapes first impressions faster than almost any other dataset. For sellers, that can make it one of the hardest factors to overcome because it affects how an area feels, not just how it performs on paper. The contrast between Westminster and the Isles of Scilly shows just how wide that gap can be across England.” |
Where road collisions are highest
Road safety is not always treated as a housing story, but it plays a bigger role than many buyers may realise. Across the study, the average area records 534.3 road collisions per billion vehicle miles. In the highest-risk areas, that figure climbs dramatically.
Inner London dominates in road collisions
| Rank | Area | Road collisions (per billion vehicle miles) |
| 1 | Hackney | 2,646 |
| 2 | Islington | 2,451 |
| 3 | Westminster | 2,414 |
| 4 | Haringey | 2,383 |
| 5 | Camden | 2,347 |
The five highest figures in the study are all in London.
Hackney ranks first with 2,646 collisions per billion vehicle miles, followed by Islington on 2,451, Westminster on 2,414, Haringey on 2,383, and Camden on 2,347.
TfL says London’s boroughs manage around 95% of the city’s roads, and the capital’s Vision Zero strategy is built around the fact that road danger is most intense on busy urban streets where large numbers of vehicles, cyclists, and pedestrians all share limited space.10
Rutland records the lowest collision rate in the study
| Rank | Area | Road collisions (per billion vehicle miles) |
| 1 | Rutland | 75 |
| 2 | West Berkshire | 113 |
| 3 | South Gloucestershire | 121 |
| 4 | Windsor and Maidenhead | 132 |
| 5 | Telford and Wrekin | 136 |
Rutland records the lowest road-collision rate in the study, at 75 per billion vehicle miles. It is followed by West Berkshire (113), South Gloucestershire (121), Windsor and Maidenhead (132), and Telford and Wrekin (136).
What stands out is the size of the gap. Rutland’s figure is a fraction of the rates seen in the highest-ranked London boroughs, showing just how differently road risk is distributed across England. While inner London’s numbers reflect dense, high-pressure streets with constant movement, the lowest-ranked areas point to a much less intense road environment overall.
| Jack Malnick tells us what this says about property risk: “The contrast between inner London and places like Rutland shows how unevenly road-collision risk is spread across England. In some areas, it is part of a wider picture of dense, high-pressure urban movement. “In others, it barely registers as a meaningful concern. For buyers and sellers, that difference can shape how manageable an area feels long before they have compared house prices alone.” |
Where flood exposure becomes hardest for buyers to ignore
Flooding is one of the most practical property risks in the ranking because it can affect far more than first impressions. It can shape insurance costs, mortgage decisions, long-term maintenance, and how confident a buyer feels about taking a property on in the first place.
Across the study, the average English area has 2.6% of properties at high flood risk. In the highest-ranking places, that figure climbs far beyond that benchmark.
There are almost 21,000 properties at a high flood risk in Hull
| Rank | Area | Properties at high flood risk |
| 1 | Kingston upon Hull | 16.8% |
| 2 | Westmorland and Furness | 15.4% |
| 3 | North Lincolnshire | 13.9% |
| 4 | Doncaster | 12.6% |
| 5 | Lincolnshire | 12.1% |
Kingston upon Hull records the highest flood exposure in the study, with 16.8% of properties classified as high flood risk – this equates to roughly 20,958 places.11
The scale of that gap is hard to miss. Every one of those places sits well above the study average, but Hull stands out because the city’s flood challenge is deeply tied to its physical layout. Hull City Council says more than 90% of the city is below high tide level, with higher land around the edges creating a bowl-like shape, leaving the city heavily reliant on pumping and flood infrastructure to manage water levels.12
| Jack explains why flood risk matters within property sales: “Flood risk can be one of the hardest issues for sellers to overcome because it can affect both value and saleability. For buyers, it can raise concerns about insurance, mortgage approval, future costs, and the home’s long-term practicality. “That can make a property harder to sell with confidence. Where flood exposure is higher, sellers may face more hesitation, more negotiation, and more pressure to justify the asking price.” |
Why area risk can make a home harder to sell
Jack Malnick, Managing Director at Sell House Fast, said:
“One of the biggest mistakes sellers can make is assuming buyers are only looking at the property itself. In reality, buyers are often assessing the wider area just as closely, especially when they are worried about anything that could affect future value, running costs, or resale potential.
“We often see hesitation creep in when there is something in the background that makes a purchase feel more uncertain, whether that is flooding, crime levels, road safety, or a combination of factors. It does not always stop a sale, but it can slow decision-making, lead to tougher negotiations, and make buyers more likely to question whether the asking price fully reflects the risks attached to the location.
“That is why sellers need to understand how their area may be perceived before they go to market. The more aware you are of the concerns buyers may have, the better prepared you are to price realistically, answer objections, and keep a sale moving.”
“For some sellers, especially those in areas where risk factors may make a sale feel more uncertain, speed and certainty can become just as important as price. In those situations, exploring options such as cash house buyers may be worth considering, particularly for homeowners who want to avoid a lengthy negotiation or the risk of a sale falling through.”
Methodology
Sell House Fast is a leading UK cash house buyer, helping homeowners secure a guaranteed sale without the delays often associated with the traditional estate agent route. By buying directly for cash and managing the process from start to finish, we offer a more straightforward option for people who value speed, certainty, and less uncertainty around their move.
To identify England’s riskiest areas to buy and sell property, we compared administrative areas in England across the following factors and combined them into an overall risk score out of 10.
Note: Geographic boundaries vary by source and have been standardised where necessary.
1. Crime rate
Number of recorded crimes (excluding fraud) per 1,000 people, sourced from ONS police force data.
2. Flood risk
Percentage of properties at high risk of flooding (>1% annual probability), sourced from the National Audit Office’s raw data files.
3. Air quality
Population-weighted annual mean PM2.5 concentration (µg/m³) for 2024, sourced from UK-AIR’s pollution data. This shows the average level of fine particulate pollution experienced by residents in each area.
4. Road safety
Road collisions per billion vehicle miles, sourced from the Department for Transport’s road safety statistics.
5. Coastal erosion risk
Percentage of residential properties at risk of coastal erosion, sourced from the Department for Environment, Food & Rural Affairs.
Based on Shoreline Management Plan (SMP) projections, using a medium-term timeframe (2020–2055) under a present-day climate scenario. The number of properties at risk was calculated as a percentage of total dwellings in each area, using GOV.UK’s live tables on dwelling stock.
Each factor was normalised, and scores were combined with equal weighting to produce an overall risk score out of 10. Higher values indicate greater risk.
All data was collected in April 2026 and is correct as of then.
Sources:
- Flood defences to be raised and strengthened – BBC
- Place and environment’s impact on health – Portsmouth City Council
- Portsmouth Surface Water Management Plan – Portsmouth City Council
- Road Safety – Southampton Data Observatory and 2025 Air Quality Annual Status Report – Southampton City Council
- 2024-2025 Annual Report – Rutland County Council
- Safer Cheshire East Partnership (SCEP) – Cheshire East Council and News Crime continues to fall in Cheshire according to latest figures – Cheshire Constabulary
- 2025 Air Quality Annual Status Report – Shropshire Council
- Budget Scrutiny Task Group – City of Westminster
- Statement of Licensing Policy 2026-2031 – Council of the Isles of Scilly
- Vision Zero action plan 2 – Transport for London
- Housing and Households – Hull City Council
- LOCAL FLOOD RISK MANAGEMENT STRATEGY 2022 – 2028 – Hull City Council
- Coverage of Thames Barrier celebrating 40 years protecting London – Department for Environment, Food & Rural Affairs