UK Gentrification Hotspots Revealed: Where House Prices Are Rising Fast
House prices in some UK towns have more than doubled in the past 20 years, with Manchester seeing a 177% rise since 2004 alone.
Once-overlooked towns and cities are now attracting higher-earning professionals, independent cafés and craft breweries are popping up on high streets, and rental prices are climbing.
For homeowners, that can mean growing equity and a chance to sell at a strong price. For renters and first-time buyers it can mean being priced out.
We analysed long-term house price growth, earnings, rental inflation, occupational shifts, and the spread of trendy businesses to reveal where gentrification is accelerating, and which areas may be next.
Our study shows that while London is often thought of as the UK’s most gentrified city, many places outside the capital are now firmly on the road to gentrification, seeing rapid social and economic change that is changing affordability.
Key findings
- Southend-on-Sea ranks as the UK’s top emerging gentrification hotspot, scoring 7.11/10 thanks to rapid house-price growth, rising rents, and a growth in lifestyle businesses.
- Manchester has seen the biggest affordability shift in the UK, with house prices rising 177% in 20 years while earnings grew just 65%, creating a 112-point gap.
- Liverpool recorded the steepest rent increases, with average rents jumping 42.3% in five years.
- Coventry has experienced the fastest workforce professionalisation, with senior and professional roles rising by 10.3 percentage points in just three years.
- Oxford leads the UK for ‘trendy’ businesses, with 352 craft breweries, artisan bakeries, and whole-food shops per 100,000 residents.
- London does not top the gentrification rankings because it is already highly transformed, despite house prices rising almost 144% since 2004.
- Three North-West areas, Manchester, Bolton, and Liverpool, appear repeatedly across the data, pointing to a regional hotspot for affordability pressure and investor demand.
The UK’s top 10 gentrification hotspots
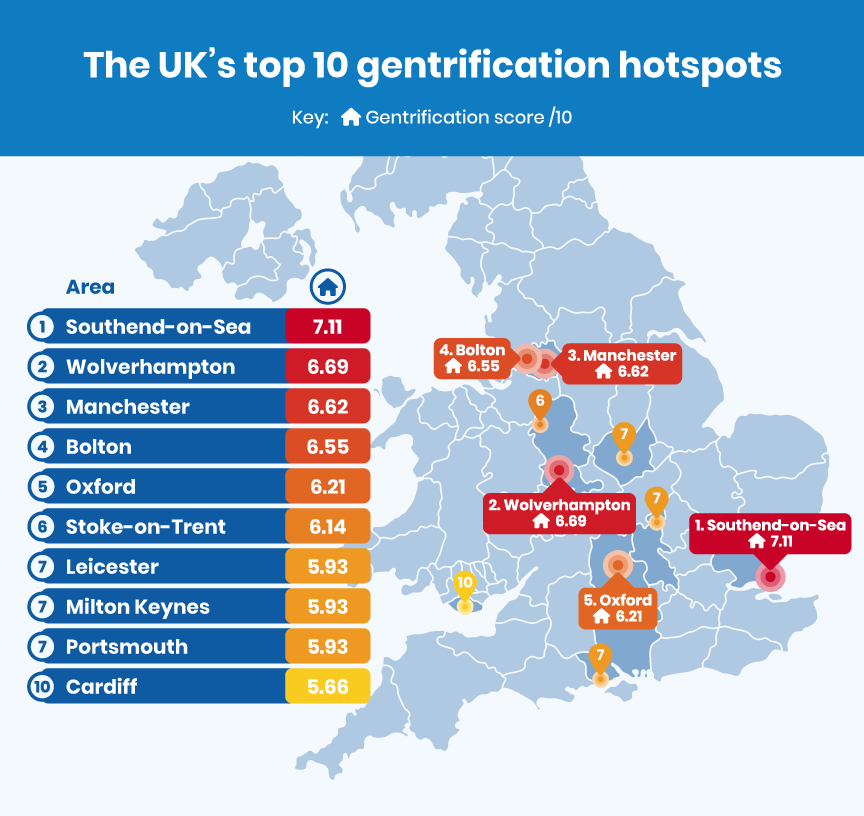
These 10 towns and cities show the clearest signs of gentrification underway, with housing costs rising, increasingly fashionable high streets, and professional workforces expanding rapidly.
We analysed five key signs of gentrification:
- House prices outpacing wages – shows wealthier buyers and investors moving in, pushing affordability down.
- Rents rising quickly – signals growing demand from young professionals competing for limited homes.
- More higher-skilled jobs – points to shifting demographics and rising local incomes.
- Growth in ‘trendy’ businesses – reflects changing consumer tastes and regenerated high streets.
| Rank | Area | Change in house prices between 2004 and 2025 | Change in earnings between 2004 and 2025 | Change in rental price from 2020 – 2025 | Change in higher-skilled jobs from 2021/22 to 2024/25 | Craft breweries, artisan bakeries, and whole food shops per 100,000 people | Gentrification score /10 |
| 1 | Southend-on-Sea | 107.0% | 74.8% | 24.6% | 8.7% | 314.3 | 7.11 |
| 2 | Wolverhampton | 89.0% | 72.3% | 39.4% | 10.0% | 44.0 | 6.69 |
| 3 | Manchester | 177.0% | 65.0% | 41.7% | 2.3% | 39.8 | 6.62 |
| 4 | Bolton | 112.1% | 60.8% | 40.4% | 3.3% | 100.0 | 6.55 |
| 5 | Oxford | 114.5% | 85.0% | 28.6% | -2.3% | 352.5 | 6.21 |
| 6 | Stoke-on-Trent | 95.5% | 68.6% | 33.1% | 5.1% | 166.2 | 6.14 |
| 7 | Leicester | 106.5% | 57.0% | 38.8% | 5.6% | 62.7 | 5.93 |
| 7 | Milton Keynes | 115.0% | 68.3% | 29.1% | 1.4% | 293.9 | 5.93 |
| 7 | Portsmouth | 83.0% | 74.5% | 37.1% | -1.2% | 258.4 | 5.93 |
| 10 | Cardiff | 90.5% | 66.1% | 35.6% | 10.2% | 23.8 | 5.66 |
- Southend-on-Sea
Southend-on-Sea ranks first after house prices surged 107% since 2004 and rents climbed nearly 25% in just five years, figures that place it well above the national averages for both owner-occupiers and renters.
A 107% rise in house prices since 2004 is significantly higher than the 95.2% average of all the cities in our study, while five-year rental growth of almost 25% outpaces inflation and wage growth over the same period. Its concentration of more than 314 ‘trendy’ businesses per 100,000 residents puts Southend closer to affluent university towns than traditional seaside resorts.
Faster rail services into London and the post-pandemic rise in remote and hybrid work have made Southend increasingly attractive to higher-earning commuters, according to Network Rail investment updates and Office for National Statistics migration data.
- Wolverhampton
Wolverhampton ranks second after undergoing one of the fastest workforce transformations in the Midlands, alongside some of the sharpest rent inflation outside London.
House prices have climbed 89% since 2004, while rents are up 39% since 2020, one of the largest increases in the UK. The number of residents in senior and professional roles has also risen, demonstrating a changing demographic profile.
Major regeneration schemes around the city centre and improved transport links to Birmingham, including the West Midlands Metro extension, have boosted Wolverhampton’s appeal to professionals and property investors. The development of HS2 has also led to buyers purchasing properties near Birmingham, with plans to sell for significant profit.
- Manchester
Manchester’s transformation stands out nationally because the scale of its price growth now rivals the affordability pressures of London two decades ago.
Average house prices have soared by 177% in 20 years, far outpacing earnings growth. Rents have jumped more than 41% since 2020, making it one of the UK’s fastest-inflating rental markets.
While the city already attracts international attention, our data suggests parts of Greater Manchester are firmly on the road to gentrification, with rising demand continuing to push prices higher.
Why doesn’t London top the table?
London recorded a huge 144% rise in average house prices over 20 years and an 89% gap between house prices and earnings growth, which are both classic indicators of gentrification.
However, it doesn’t rank highest in our overall index because it has already been gentrified for decades.
Instead, our study focuses on where similar patterns are emerging now, revealing the towns and cities that are beginning to follow the capital’s trajectory.
Cities with the biggest occupational shifts see up to a 10.3% rise in senior roles between 2024 and 2025
A rising proportion of managers, professionals, and senior officials is one of the clearest signs an area is gentrifying. These higher-earning workers typically drive demand for new housing, premium rentals, and lifestyle amenities, often pushing prices higher across surrounding neighbourhoods.
| October 2024 to September 2025 | ||
| Rank | City/town | Percentage change in senior roles |
| 1 | Coventry | 10.3% |
| 2 | Cardiff | 10.2% |
| 3 | Wolverhampton | 10.0% |
| 4 | Southend-on-Sea | 8.7% |
| 5 | Newcastle upon Tyne | 8.5% |
- Coventry
Coventry recorded the biggest workforce shift, moving from a largely mid-skilled employment base to a profile now dominated by professional and managerial roles, which is a pace of change rarely seen outside major regeneration zones.
The shift comes alongside the expansion of advanced manufacturing clusters tied to Coventry University and city-centre redevelopment projects backed by the West Midlands Combined Authority.
For homeowners in Coventry, this evolving demographic could make now an attractive time to sell, particularly to investors or cash house buyers looking to secure property before values climb further.
- Cardiff
Cardiff’s workforce has seen a dramatic transformation, with senior and professional roles increasing by over 10% since 2021, compared to the average 2.3% of all cities in our study. Expansion in financial services, media industries, and large public-sector employers has helped reshape the city’s employment profile.
As better-paid workers move in, competition for housing intensifies, particularly in central districts and commuter suburbs.
- Wolverhampton
Wolverhampton appears again, reinforcing its status as a city firmly on the road to gentrification. The share of residents in senior roles has climbed from 38% to more than 48%, reflecting regeneration projects, new business parks, and growing appeal to Birmingham commuters.
This professionalisation of the workforce often leads to redevelopment of older housing stock and rising rents in previously affordable neighbourhoods. For long-term owners, that shift could translate into increasing equity and a chance to exit the market at a strong price before affordability is harder to attain.
The UK cities where house prices have outpaced wages by up to 112%
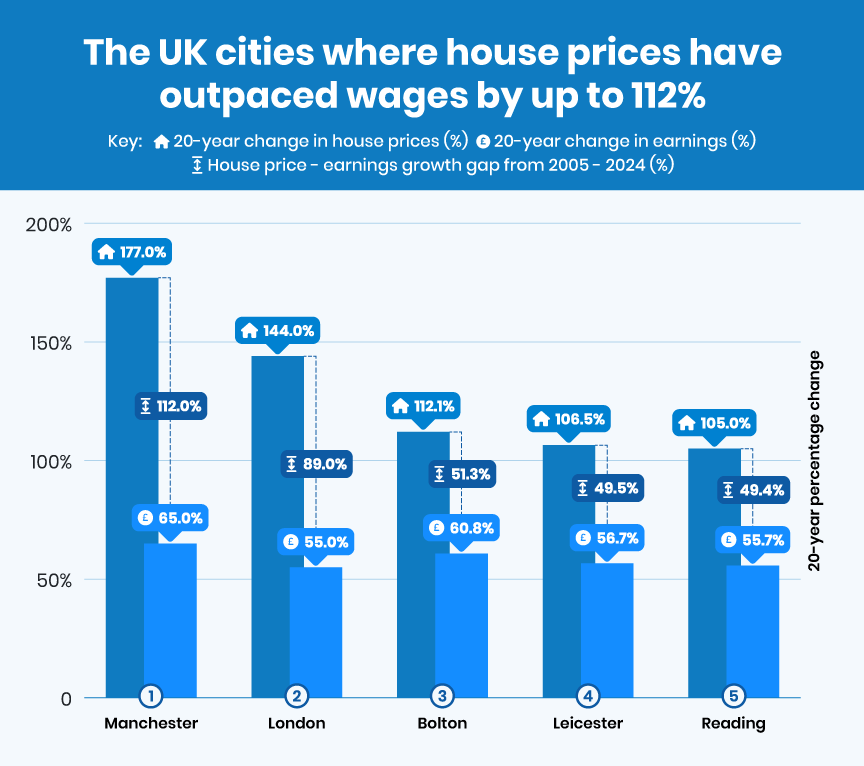
These gaps show where affordability has deteriorated fastest, an indicator of later-stage gentrification, when wealthier buyers replace local demand, and pricing detaches from local pay rates.
When wages fail to keep pace with housing costs, pressure mounts on renters, first-time buyers, and lower-income households, while homeowners can see significant gains in equity.
| Rank | City/town | 2004 average house price | 2024 average house price | 20-year percentage change in house prices | Median earnings 2005 | Median earnings 2024 | 20-year percentage change in earnings | House price – earnings growth gap from 2005 – 2024 |
| 1 | Manchester | £87,313 | £241,815 | 177.0% | £17,208 | £28,386 | 65.0% | 112.0% |
| 2 | London | £228,614 | £557,768 | 144.0% | £24,704 | £38,293 | 55.0% | 89.0% |
| 3 | Bolton | £90,258 | £191,404 | 112.1% | £17,305 | £27,821 | 60.8% | 51.3% |
| 4 | Leicester | £111,107 | £229,433 | 106.5% | £16,471 | £25,853 | 567.0% | 49.5% |
| 5 | Reading | £170,968 | £350,556 | 105.0% | £21,030 | £32,730 | 55.7% | 49.4% |
- Manchester
Manchester ranks first, recording the largest gap between house price growth and earnings of any major UK city. Average prices jumped from £87,313 in 2004 to £241,815 in 2024, a 177.0% rise, while median pay increased by just 65.0%.
The 112-percentage-point gap reflects explosive demand driven by large-scale regeneration, inward migration, and a booming professional workforce. For property owners, these conditions often attract investors and cash house buyers keen to secure homes before values move even higher.
- London
London follows closely behind, with house prices climbing from £228,614 to £557,768 in two decades, a 144.0% increase, compared with earnings growth of 55.0%.
Although London has already been transformed over many years, these figures demonstrate how sustained demand can impact the property market. In such competitive environments, sellers frequently explore faster routes to market, including selling to cash house buyers to avoid lengthy chains.
- Bolton
Bolton completes the top three, showing how gentrification pressure is spreading beyond major cities into surrounding towns. House prices more than doubled from £90,258 to £191,404, rising 112.1%, while earnings grew by 60.8%.
As Manchester’s market becomes increasingly expensive, buyers and renters are pushed further out, driving demand in commuter towns like Bolton. For long-term homeowners, that shifting affordability can make now an opportune moment to consider selling, particularly while interest from investors remains strong.
Rental prices have increased by over 42% since 2025 in some UK cities
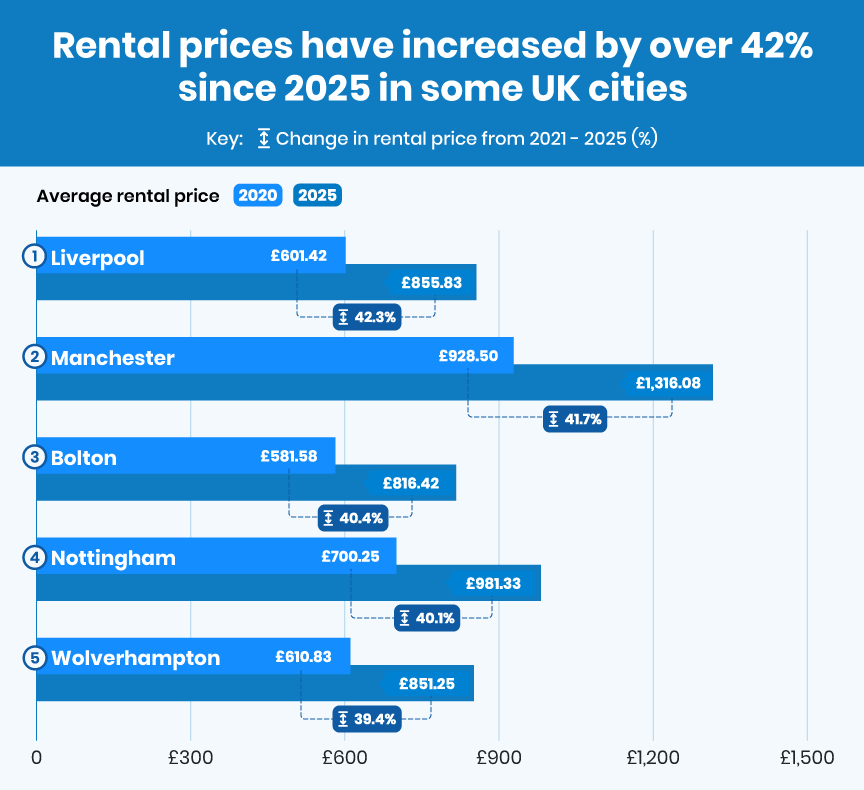
Sharp rental inflation often appears years before house-price booms, reflecting inward migration and supply shortages flagged repeatedly in ONS rental market releases.
| Rank | City/town | Average rental price 2020 | Average rental price 2025 | Change in rental price from 2021 – 2025 |
| 1 | Liverpool | £601.42 | £855.83 | 42.3% |
| 2 | Manchester | £928.50 | £1,316.08 | 41.7% |
| 3 | Bolton | £581.58 | £816.42 | 40.4% |
| 4 | Nottingham | £700.25 | £981.33 | 40.1% |
| 5 | Wolverhampton | £610.83 | £851.25 | 39.4% |
- Liverpool
Liverpool tops the rental-growth table, with average monthly rents soaring by more than 42% since 2020. Waterfront developments, cultural investment, and growing student numbers have all added pressure to the city’s private rental sector.
For landlords and homeowners alike, rising rents can boost property values, but they can also encourage sellers to cash in while competition for homes remains fierce, especially from cash buyers targeting high-yield areas.
- Manchester
Rental prices have jumped almost 42% in five years, driven by population growth, international investment, and a rise in city-centre apartment developments.
These conditions can be ideal for sellers, particularly those looking for a quick exit without renegotiations or a chain collapse, which are commonly mitigated by cash house buyers.
- Bolton
Bolton’s sharp rise in rents shows how gentrification pressure is spilling out from neighbouring cities. As Manchester becomes less affordable, renters are moving further afield, driving up demand and prices in surrounding towns.
That shift is often followed by stronger house-price growth, meaning homeowners who sell now may benefit from buyers trying to get ahead of the next surge.
The UK cities where there are over 350 ‘trendy businesses’ per 100,000 residents
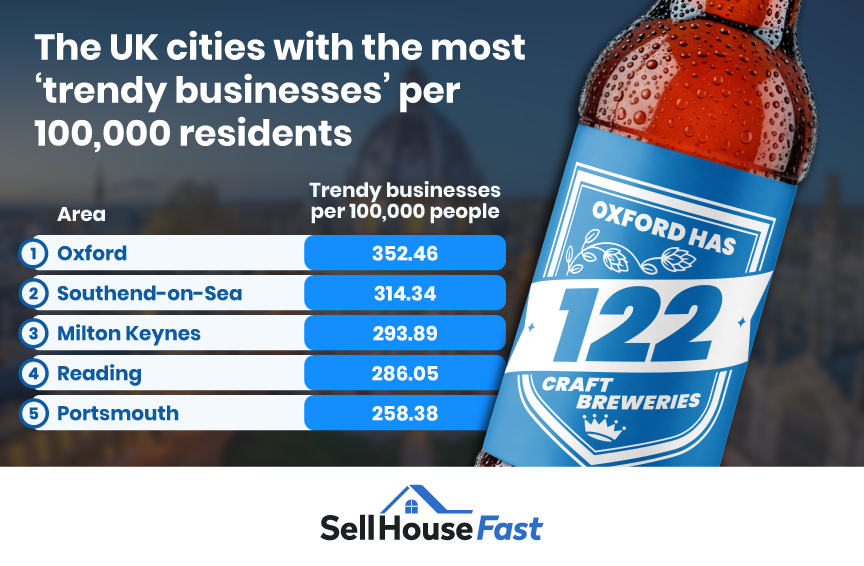
The spread of ‘trendy’ businesses such as craft breweries, artisan bakeries, and whole-food shops is another indicator of gentrification, reflecting changing tastes, rising disposable incomes, and shifting demographics.
| Rank | Area | Trendy businesses per 100,000 people |
| 1 | Oxford | 352.46 |
| 2 | Southend-on-Sea | 314.34 |
| 3 | Milton Keynes | 293.89 |
| 4 | Reading | 286.05 |
| 5 | Portsmouth | 258.38 |
- Oxford
Oxford leads the country, with 122 craft breweries and more than 600 ‘trendy’ food and drink outlets overall. Its highly educated population, world-class university, and science parks have created a customer base willing to pay for expensive experiences.
This kind of commercial environment usually mirrors rising housing demand, making Oxford an attractive market for sellers, particularly those approached by cash buyers seeking property in affluent, supply-constrained cities.
- Southend-on-Sea
Southend’s transformation is being reflected not just in house prices but in its high street. There are 573 ‘trendy’ businesses overall, including 240 artisan bakeries. A rapidly growing café culture and independent food scene signal rising spending power among residents moving out of London.
These lifestyle shifts often accompany an influx of higher-earning households, helping to push property values upward. For long-term homeowners, that could make now a prime moment to explore selling options while interest rates continue to rise.
- Milton Keynes
Milton Keynes’ booming business base and commuter links to London have helped fuel a surge in premium food and drink outlets. Its growing population of professionals is reshaping retail districts and increasing competition for family housing.
That demand can place sellers in a strong negotiating position, especially those opting for quick, chain-free transactions through cash house buyers.
Jack Malnick, Managing Director of Sell House Fast, comments on where house prices could surge:
“What this research really shows is that several UK towns are now at the same point London reached years ago, where professional populations are rising quickly, lifestyle businesses are spreading, and housing costs are rising faster than wages.
“Places such as Southend-on-Sea, Wolverhampton, and Bolton stand out. They still look affordable compared with London, but our data suggests that window may not last long as demand continues to build.
“For homeowners in these areas, interest from investors and cash house buyers is likely to increase. Sellers who move while their town is mid-gentrification may be able to secure strong offers without waiting months on the open market, especially where chains and mortgage delays are slowing traditional sales.”
What is the impact of gentrification?
Gentrification has varying effects on different people:
Who benefits?
- Long-term homeowners seeing property values rise
- Landlords in high-demand rental markets
- Sellers looking to capitalise on growing buyer interest
Who loses out?
- Renters facing steep increases
- First-time buyers priced out of once-affordable areas
- Lower-income households forced to move further afield
- As affordability shifts, many homeowners are considering selling sooner rather than later, especially as demand remains strong
Is it time to cash in?
If you own property in one of the UK’s emerging gentrification hotspots, rising prices and investor interest could make this an ideal moment to sell.
Sell House Fast helps homeowners secure a guaranteed sale without estate agents, lengthy chains, or hidden fees, offering a simple way to capitalise on changing market conditions.
Methodology
Sell House Fast is a leading UK cash house buyer, helping homeowners achieve a guaranteed sale without the uncertainty or waiting times of the open market – completing sales in as little as seven days.
Interested in the different factors affecting house prices, including gentrification, we analysed the top 30 most populated towns and cities in the UK on the following:
- House prices vs earnings
For each local authority, we calculated the percentage change in average house price over the last 20 years using the House Price Index.
We then calculated the percentage change in median annual earnings over the same period using ONS Earnings and Hours Worked.
We calculated the house price growth vs earnings growth gap to show the areas that have been gentrified.
- Rental price increase
We took the percentage change in average monthly rent over the last 5 years from ONS Price Index of Private Rents to show the areas that are heading towards gentrification.
- Occupational shift
We used the Annual Population Survey to find the percentage of residents working in any of the following:
- Managers, directors, and senior officials
- Professional occupations
- Associate professional occupations
We took this for the most recent period available and the 3 years previous, then calculated the percentage difference in each area to show the areas heading towards gentrification.
- Growth of ‘trendy’ businesses
We used Yelp to find the current number of the following businesses in each area:
- Craft breweries
- Whole food shops
- Artisan bakeries
We then normalised by population.
Finally, we used a weighted table to normalise each factor with a score out of 10. We averaged these scores to get our overall score out of 10 for each city.
All data was collected in January 2026 and is correct as of then.