
UK Repossessions Surge Post-Pandemic as Renters Outpace Homeowners
Property repossessions across England and Wales have risen sharply since the pandemic, with renter cases now more than eight times higher than mortgage repossessions.
Although levels remain below their early-2010s peak, official court data shows a clear post-COVID rebound, particularly in the private rental sector. In some London boroughs, repossession rates are approaching 200 per 100,000 residents.
For struggling homeowners and landlords, this trend signals growing financial pressure. For those already in arrears, acting early, including exploring options with cash house buyers, can prevent court escalation and long-term credit damage.
We analysed 10 years of Ministry of Justice possession statistics to reveal:
- How mortgage and renter repossessions have changed since 2014
- The scale of the post-pandemic rebound
- Where repossession rates are highest
- How renter cases, where a private landlord regains possession of a rental property through the courts, can be compared to homeowner cases, where a lender takes possession of a property after a homeowner falls into mortgage arrears
- What steps can be taken to avoid repossession
Key findings
- Renter repossessions are now more than eight times higher than mortgage repossessions.
- Renter repossessions reached 27,117 in 2024, the highest level since 2016.
- Mortgage repossessions rose 98% between 2021 and 2024.
- Newham records the highest repossession rate in England and Wales at 196.8 per 100,000 residents.
- Eight of the top ten repossession hotspots are London boroughs.
- Repossessions have risen more than 500% since the COVID low in 2020.
Government data shows UK repossessions rebound to highest level since 2016
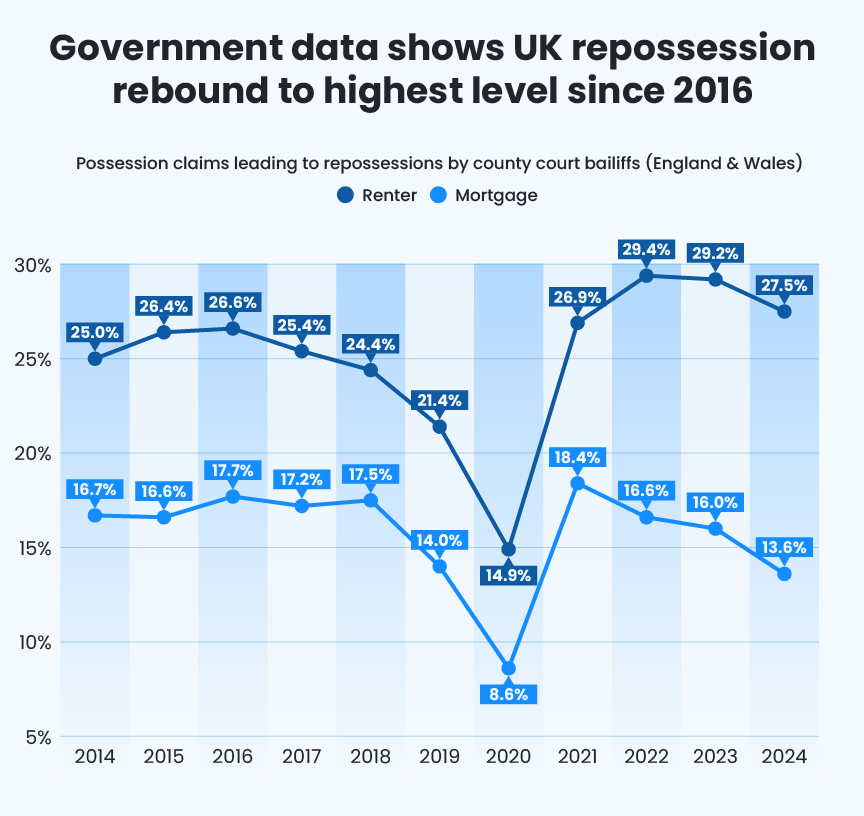
Because repossessions take time to progress through the courts, we analysed completed repossessions carried out by county court bailiffs between 2014 and 2024.
We excluded 2025 data, as according to Ministry of Justice guidance, possession statistics are subject to reporting lag and revision, particularly for recent quarters. Because possession cases can take many months to progress to bailiff enforcement, we compared 2014 with the latest complete annual dataset available.
| Mortgage possession claims leading to repossessions by county court bailiffs (England & Wales) | |||
| Year | Claims resulting in repossession | % of claims resulting in repossession | YoY change |
| 2014 | 6,878 | 16.7% | -36.2% |
| 2015 | 3,286 | 16.6% | -52.2% |
| 2016 | 3,258 | 17.7% | -0.9% |
| 2017 | 3,415 | 17.2% | 4.8% |
| 2018 | 3,417 | 17.5% | 0.1% |
| 2019 | 3,575 | 14.0% | 4.6% |
| 2020 | 475 | 8.6% | -86.7% * |
| 2021 | 1,590 | 18.4% | 234.7% |
| 2022 | 2,190 | 16.6% | 37.7% |
| 2023 | 2,652 | 16.0% | 21.1% |
| 2024 | 3,146 | 13.6% | 18.6% |
*COVID
Notes: Multiple warrants may be issued per claim.
Please note that the figures provided for warrants and repossessions in more recent quarters are significantly lower than those seen in the previous quarters, as the claims are working their way through the system.
Mortgage repossessions collapsed during 2020 due to emergency protections. However, since 2021, they have almost doubled, rising 98% in three years.
Although 2024 remains below 2014 levels, the upward trend in repossessions since 2021 coincides with a period of higher interest rates and wider cost-of-living pressures.
The post-COVID rebound
The rebound is even more striking when compared with the 2020 low point:
- Mortgage repossessions up 562% from 2020 to 2024
- Renter repossessions up 358% over the same period
The end of eviction bans and mortgage payment holidays has reset enforcement activity to more typical levels, with court backlogs now working through the system.
Because possession cases can take months to progress, recent enforcement figures may reflect financial pressures experienced in earlier years.
Renter repossessions hit the highest level since 2016 as cases double post-pandemic
Landlord repossessions, often due to rent arrears or tenancy breaches, are significantly higher than mortgage repossessions, when a homeowner falls into mortgage arrears.
| Landlord possession claims leading to repossessions by county court bailiffs (England & Wales) | |||
| Year | Claims resulting in repossession | % of claims resulting in repossession | YoY change |
| 2014 | 41,168 | 25.0% | 4.6% |
| 2015 | 40,576 | 26.4% | -1.4% |
| 2016 | 36,507 | 26.6% | -10.0% |
| 2017 | 33,680 | 25.4% | -7.7% |
| 2018 | 29,744 | 24.4% | -11.7% |
| 2019 | 23,680 | 21.4% | -20.4% |
| 2020 | 5,914 | 14.9% | -75.0% * |
| 2021 | 10,234 | 26.9% | 73.0% |
| 2022 | 23,104 | 29.4% | 125.8% |
| 2023 | 27,494 | 29.2% | 19.0% |
| 2024 | 27,117 | 27.5% | -1.4% |
*COVID
Notes: Multiple warrants may be issued per claim.
Please note that the figures provided for warrants and repossessions in more recent quarters are significantly lower than those seen in the previous quarters, as the claims are working their way through the system.
In 2024, there were:
- 27,117 renter repossessions
- 3,146 mortgage repossessions
That means renter cases are 8.6 times higher than homeowner repossessions.
The percentage of claims resulting in repossession also differs:
- Mortgage claims resulting in repossession (2024): 13.6%
- Renter claims resulting in repossession (2024): 27.5%
The divergence reflects structural differences between renter and mortgage possession processes:
- The Bank of England’s base rate increased repeatedly between 2022 and 2023, which led to higher mortgage pricing across both residential and buy-to-let markets.
- UK Finance statistics show that a large share of buy-to-let lending is on fixed-term products. This means many landlords refinance at the end of those terms, and when fixed deals taken out at historically low rates expire, monthly repayments can rise materially.
- At the same time, government data shows the private rented sector has grown substantially over the past two decades. A larger rental base naturally increases exposure to possession claims during periods of financial stress.
- In addition, ongoing reforms to landlord legislation, including changes affecting Section 21 notices and wider tenancy reforms, have introduced regulatory uncertainty for some investors. While these reforms are primarily designed to strengthen tenant protections, they may also influence how landlords manage arrears risk and portfolio decisions going forward.
London borough tops UK repossession data with nearly 200 cases per 100,000 residents
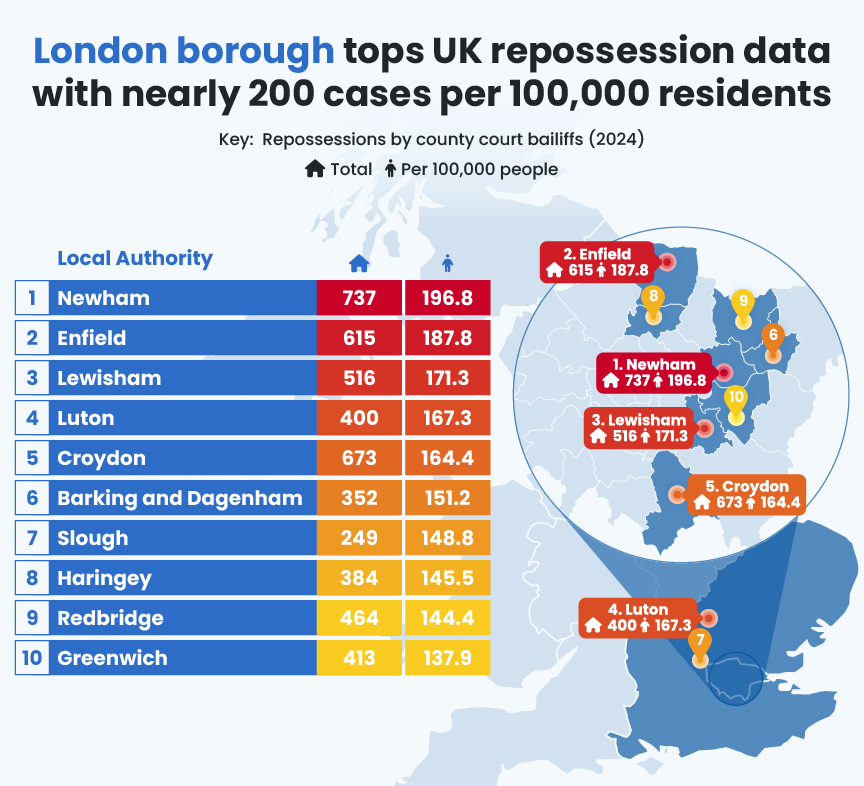
We analysed total repossessions across all types in 2024 and normalised them per 100,000 residents using ONS population data.
| Repossessions by county court bailiffs (2024) | |||||
| Rank | Local authority | Region | Population | Total | Per 100,000 people |
| 1 | Newham | London | 374,523 | 737 | 196.8 |
| 2 | Enfield | London | 327,434 | 615 | 187.8 |
| 3 | Lewisham | London | 301,255 | 516 | 171.3 |
| 4 | Luton | East of England | 239,090 | 400 | 167.3 |
| 5 | Croydon | London | 409,342 | 673 | 164.4 |
| 6 | Barking and Dagenham | London | 232,747 | 352 | 151.2 |
| 7 | Slough | South East | 167,359 | 249 | 148.8 |
| 8 | Haringey | London | 263,850 | 384 | 145.5 |
| 9 | Redbridge | London | 321,231 | 464 | 144.4 |
| 10 | Greenwich | London | 299,528 | 413 | 137.9 |
- Newham: England’s highest repossession rate
Newham recorded 737 completed repossessions in 2024, equivalent to 196.8 per 100,000 residents, demonstrating the highest rate nationally.
Census data shows Newham has one of the highest proportions of privately renting households in England and Wales. Areas with larger private rented sectors typically record higher volumes of renter possession cases in Ministry of Justice data, because landlord claims make up the majority of possession proceedings nationally.
For homeowners in Newham facing rising arrears, early action is critical. Support may be available through organisations such as Citizens Advice, local council housing teams, or independent debt advisers.
For some, exploring options with cash house buyers may also provide certainty before the court process escalates, particularly where speed is essential to prevent enforcement.
- Enfield: outer-London pressure point
Enfield ranks second with 187.8 repossessions per 100,000 residents in the most recent year.
As with several outer-London boroughs, Enfield includes a mix of owner-occupied and privately rented housing.
Mortgage rates rose sharply between 2022 and 2023, while ONS data shows private rents have increased annually across London. Where both mortgage and rental costs rise, possession claims can increase across both tenure types, reflected in Enfield’s elevated per-capita rate.
Ministry of Justice data also shows that renter claims consistently account for the majority of possession activity across England and Wales, which contributes to higher enforcement totals in areas with large rental markets.
- Lewisham: affordability strain in South London
Lewisham had 171.3 repossessions per 100,000 residents in 2024.
Like Newham, Census 2021 data indicates a substantial private rented sector. London-wide rental inflation and constrained housing supply have been widely documented in official statistics.
In boroughs with high rental penetration and affordability pressures, renter possession claims form a large share of total enforcement activity.
Regional divide: where repossessions are rising outside of London
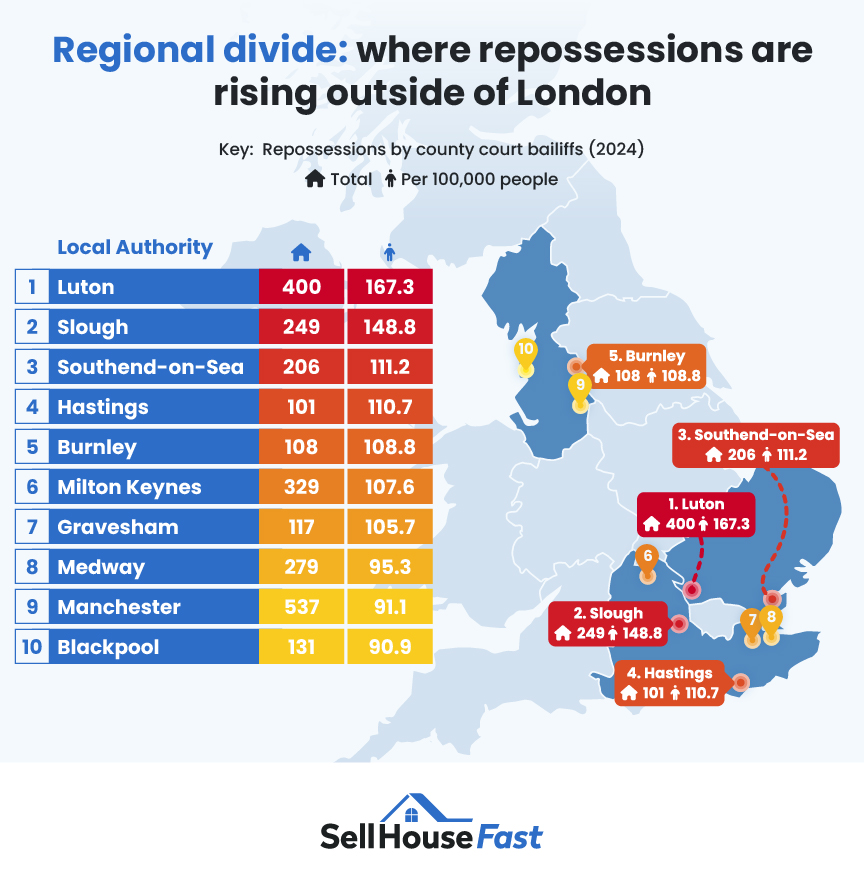
Although London dominates the national rankings, several non-London authorities record similarly high per-capita enforcement rates.
| Repossessions by county court bailiffs (2024) | |||||
| Rank | Local authority | Region | Population | Total | Per 100,000 people |
| 1 | Luton | East of England | 239,090 | 400 | 167.3 |
| 2 | Slough | South East | 167,359 | 249 | 148.8 |
| 3 | Southend-on-Sea | East of England | 185,256 | 206 | 111.2 |
| 4 | Hastings | South East | 91,219 | 101 | 110.7 |
| 5 | Burnley | North West | 99,233 | 108 | 108.8 |
| 6 | Milton Keynes | South East | 305,884 | 329 | 107.6 |
| 7 | Gravesham | South East | 110,671 | 117 | 105.7 |
| 8 | Medway | South East | 292,655 | 279 | 95.3 |
| 9 | Manchester | North West | 589,670 | 537 | 91.1 |
| 10 | Blackpool | North West | 144,191 | 131 | 90.9 |
The South East features prominently, particularly Slough, Hastings, Milton Keynes, and Gravesham. These areas sit within commuter and coastal markets where affordability pressures have intensified in recent years, shown through rental price increases.
Luton records 167.3 repossessions per 100,000 residents, placing it fourth nationally overall and the highest outside London. Slough follows with 148.8 per 100,000. Both sit within high-density urban markets in the South East and East of England, where private renting forms a significant share of housing tenure.
Southend-on-Sea (111.2), Hastings (110.7) and Burnley (108.8) cluster closely together, showing that elevated repossession rates are not confined to commuter belts alone but also appear in coastal and northern authorities.
Milton Keynes (107.6), Gravesham (105.7) and Medway (95.3) reinforce the prominence of the South East in the rankings. Meanwhile, Manchester (91.1) and Blackpool (90.9) demonstrate that parts of the North West also record high enforcement levels relative to population size.
The regional divide is not binary. Repossession activity clusters where high rental penetration, elevated housing costs, and income volatility intersect, a pattern evident in the South East and parts of the North West.
Jack Malnick, Managing Director of Sell House Fast, advises on how to avoid repossession:
“What this data shows is that repossessions are rising steadily as pandemic protections fade and higher borrowing costs continue to impact both homeowners and renters.
“People might be worried about falling into arrears. If you are, the key is acting before the court stage. Once bailiffs are involved, options become narrower.
“For some homeowners, selling early can prevent long-term credit damage and avoid the stress of court enforcement. Others may benefit from speaking to their lender, seeking debt advice, or contacting organisations such as Citizens Advice to understand their rights.
If a fast, guaranteed sale is required to stop the legal process, working with cash house buyers can provide certainty and speed. The sooner advice is sought, the more control people retain.”
Is it time to take action?
Repossessions follow a structured legal pathway:
- Missed payments
- Arrears correspondence
- Court claim
- Possession order
- Bailiff enforcement
Intervening before the final stage significantly widens the available options.
If you are facing:
- Mortgage arrears
- Buy-to-let payment pressure
- A pending court hearing
- Threat of bailiff enforcement
Exploring alternatives early can protect both your finances and your credit file.
Sell House Fast works with homeowners who need certainty, speed, and discretion. Unlike traditional estate agent sales, which can collapse due to chains or mortgage delays, working with experienced cash house buyers can provide:
- No estate agent fees
- No chains
- No mortgage dependency
- Completion in as little as seven days
For some, that speed can make the difference between resolving arrears and entering repossession proceedings.
Methodology
Sell House Fast is a leading quick-sale property company that helps homeowners across the UK sell their homes swiftly and securely, without the delays or uncertainty of the open market.
As part of our commitment to helping UK sellers secure quick and stress-free property sales, we have produced this report to provide clear insight into how repossession trends are changing across England and Wales, where risks are most concentrated, and what practical steps homeowners and renters can take to protect their position.
This analysis is based on publicly available Ministry of Justice possession statistics. It does not constitute financial advice.
All data was sourced from the Ministry of Justice: Mortgage and landlord possession statistics. Because repossessions take time to progress through the legal system, the Ministry of Justice notes that figures for the most recent periods are often lower than final totals. For this reason, we analysed data from 2014 to 2024 and excluded 2025.
First, we looked at the number of completed repossessions carried out by county court bailiffs over this period, split by mortgage and landlord cases.
Then, we analysed the number of total repossessions (across all types), in each local authority in England & Wales in 2024, normalising these per 100,000 people using the Office for National Statistics: Estimates of the population for the UK, England, Wales, Scotland, and Northern Ireland.