The Most Affordable Places to Live in Britain (2026)
With the cost of living continuing to put pressure on household budgets, choosing where to live has become just as important as how much you earn. House prices, rent, mortgage costs and everyday expenses all affect how far your income goes, but these costs vary significantly across Britain.
To uncover the most affordable places to live, we analysed every local authority across Great Britain using six key affordability measures, like annual earnings, house prices, rental costs and access to budget supermarkets.
For homeowners considering a move, understanding where wages stretch further can be a valuable part of planning the next step. Whether you are relocating for affordability or exploring options with a cash house buyer, this study highlights the areas where income, housing costs and everyday expenses combine to create the strongest affordability.
Key findings
- Cumberland ranks as Britain’s most affordable place to live, with an affordability score of 9.07 out of 10.
- 9 of the 10 most affordable local authorities are located in northern England, with the North East, North West and Yorkshire all heavily represented.
- North Lanarkshire is Scotland’s highest-ranked area, placing second overall.
- The average home in Cumberland costs £179,966.
- Estimated mortgage repayments leave homeowners in Cumberland with 76.38% of their annual income remaining, compared with -36.59% in Kensington and Chelsea.
Jack Malnick, Managing Director at Sell House Fast, comments:
“One of the biggest misconceptions is that moving somewhere with higher salaries automatically leaves you better off.
“Our findings show that’s often not the case.
“In many northern areas, wages may be slightly lower than in London or the South East, but significantly cheaper housing means households keep much more of what they earn each month. That difference can have a much bigger impact on long-term financial security than salary alone.”
Britain’s most affordable places to live
| Rank | Area | Region | Median annual pay | Percentage of income left over after annual mortgage payments | Percentage of income left after rent | Budget supermarkets per 100,000 people | Affordability score/10 |
| 1 | Cumberland | North West | £33,840 | 73.86% | 76.38% | 10.07 | 9.07 |
| 2 | North Lanarkshire | Scotland | £34,105 | 75.94% | 71.53% | 9.00 | 8.66 |
| 3 | Doncaster | Yorkshire and the Humber | £31,119 | 71.35% | 73.43% | 11.41 | 8.50 |
| 3 | Burnley | North West | £29,680 | 76.46% | 74.85% | 10.26 | 8.50 |
| 5 | Barnsley | Yorkshire and the Humber | £31,359 | 71.04% | 74.06% | 9.23 | 8.46 |
| 6 | Middlesbrough | North East | £30,253 | 75.90% | 71.96% | 11.72 | 8.44 |
| 7 | Hartlepool | North East | £28,830 | 75.43% | 76.65% | 13.55 | 8.43 |
| 8 | County Durham | North East | £29,718 | 75.55% | 74.24% | 9.36 | 8.39 |
| 9 | Darlington | North East | £30,100 | 72.50% | 73.05% | 10.82 | 8.37 |
| 9 | Chorley | North West | £33,337 | 66.90% | 71.96% | 9.18 | 8.35 |
1. Cumberland: Homebuyers keep nearly 74% of their income after mortgage costs
Cumberland tops the rankings thanks to a strong balance between earnings and housing costs. With a median annual salary of £33,840 and average house prices of £170,966, buyers face a house price-to-income ratio of 5.05, well below the British average of 9.35.
Estimated monthly mortgage repayments sit at around £737, leaving homeowners with almost 74% of their annual income after mortgage costs. Rent also remains relatively affordable, while residents benefit from more than 10 budget supermarkets per 100,000 people, helping to keep everyday grocery costs competitive.
2. North Lanarkshire: Scotland’s most affordable area, with homes worth just 4.6 times local earnings
North Lanarkshire is Scotland’s most affordable local authority, ranking second in Britain overall.
Median annual earnings reach £34,105, while average house prices remain relatively low at £158,591, producing one of the lowest house price-to-income ratios in the rankings at 4.42.
Mortgage affordability is particularly strong, with estimated repayments leaving residents with 75.94% of their income after housing costs. Although rents are slightly higher than in some northern English authorities, the area’s combination of wages and property prices makes it one of Britain’s strongest value locations.
3. Doncaster: More than 11 budget supermarkets per 100,000 residents help keep everyday costs down
Doncaster performs well across every affordability measure rather than relying on a single standout statistic.
The average home costs £172,305, while the average annual rent is £8,268. Combined with median earnings of £31,119, this allows residents to retain more than 71% of their income after estimated mortgage repayments.
The area also benefits from excellent access to lower-cost supermarkets, with 11.41 budget stores per 100,000 residents, supporting lower everyday living costs.
90% of Britain’s most affordable areas are in northern England

Nine of the top 10 local authorities are located across the North East, North West and Yorkshire and the Humber. Scotland also performs strongly, with North Lanarkshire second overall and several authorities in the top 25.
A common theme across these areas is the relationship between earnings and house prices. While average salaries are often slightly below those found in parts of southern England, significantly lower property values mean residents spend a much smaller proportion of their income on housing.
Access to lower-cost supermarkets is also stronger across many of the highest-ranked authorities. Hartlepool, Middlesbrough, Doncaster and Hyndburn all record above-average numbers of budget supermarkets per head of population, helping households manage ongoing grocery costs alongside housing expenses.
Jack Malnick, at Sell House Fast, comments:
“People often focus on house prices alone when comparing different locations, but affordability is much broader than that. Areas where earnings remain competitive, housing costs stay proportionate and essential services are widely available tend to offer the best long-term value, particularly for first-time buyers and families planning their next move.”
Where is housing least affordable?
While northern England and Scotland dominate the top of the rankings, the picture is very different across much of London and the South East.
High salaries alone are not enough to offset rising property values in many parts of southern Britain. Areas with some of the highest earnings also record the highest house price-to-income ratios, leaving residents with significantly less disposable income after mortgage repayments.
The 10 least affordable local authorities are:
| Rank | Area | Region | Median annual pay | Percentage of income left over after annual mortgage payments | Percentage of income left after rent | Budget supermarkets per 100,000 people | Affordability score/10 |
| 1 | Chichester | South East | £28,585 | 21.97% | 44.38% | 3.92 | 1.22 |
| 2 | Bath and North East Somerset | South West | £32,481 | 34.84% | 30.51% | 2.52 | 1.45 |
| 3 | Brent | London | £34,871 | 18.97% | 31.00% | 3.44 | 1.47 |
| 4 | Tandridge | South East | £33,316 | 25.05% | 41.58% | 2.22 | 1.59 |
| 5 | Ealing | London | £35,665 | 15.10% | 30.69% | 4.48 | 1.67 |
| 6 | Westminster | London | £45,172 | -0.42% | 15.97% | 0.95 | 1.66 |
| 7 | Kensington and Chelsea | London | £46,690 | -36.59% | 7.71% | 0.00 | 1.66 |
| 8 | Adur | South East | £380,120 | 34.91% | 45.08% | 3.09 | 1.74 |
| 9 | Camden | London | £44,088 | 4.34% | 24.90% | 3.22 | 1.79 |
| 10 | Hackney | London | £40,237 | 22.11% | 21.80% | 3.01 | 1.77 |
In Kensington and Chelsea, the average home costs more than £1.23 million, almost four times the Great Britain average. Based on our estimated mortgage calculations, annual repayments would exceed the area’s median annual salary and equal approximately 141% of the area’s median income.
Even areas with comparatively high salaries struggle to offset soaring property values. Camden, Westminster, Hackney, and Hammersmith and Fulham all have median annual earnings above £40,000, yet each ranks among the least affordable places to live because housing costs consume a large share of income.
The South East also features prominently in the lowest rankings. Areas including Chichester and Tandridge combine above-average property prices with house price-to-income ratios exceeding 12 in some cases, making home ownership considerably less accessible than elsewhere in Britain.
Jack comments:
“Affordability tends to be driven by balance rather than any single metric. Areas that perform well consistently combine sensible property values, reasonable earnings and lower day-to-day costs.
“That’s important because buyers aren’t just budgeting for a mortgage anymore. They’re also considering transport, food shopping and other regular expenses before deciding where to move.”
Regional spending patterns across Great Britain
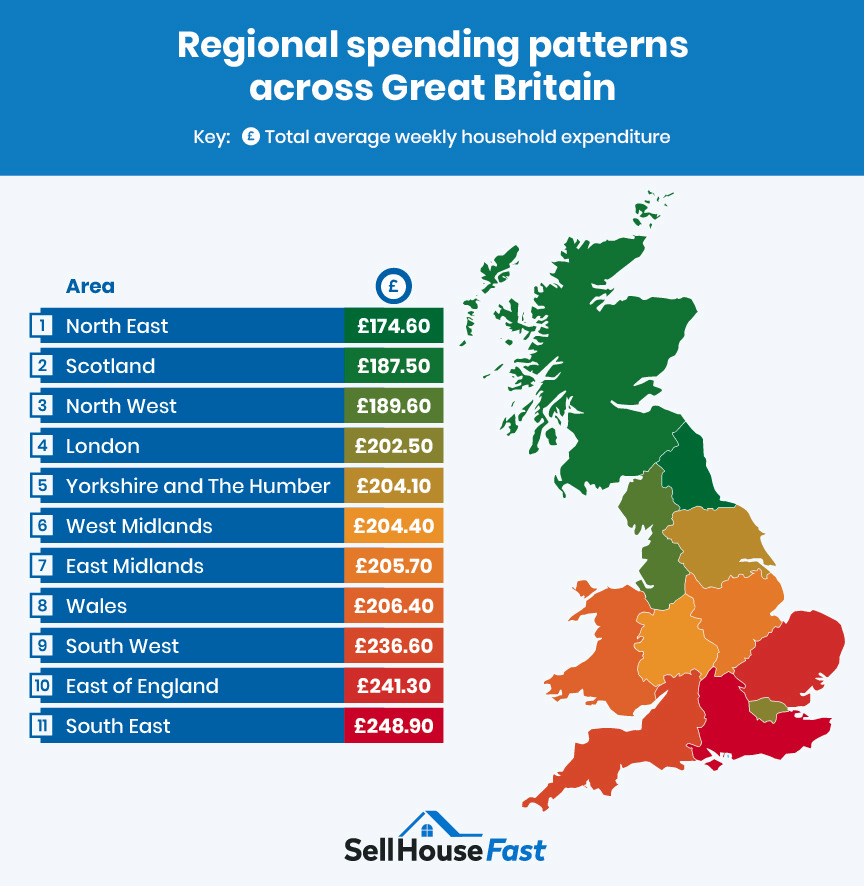
Day-to-day spending on groceries, transport and leisure also affects how affordable an area feels.
Regional figures from the Office for National Statistics reveal clear differences in weekly household spending across Great Britain.
| Average weekly household expenditure | ||||||
| Rank | Region | Food & non-alcoholic drinks | Restaurants & hotels | Alcoholic drinks, tobacco & narcotics | Transport | Total expenditure |
| 1 | North East | £60.50 | £35.90 | £9.20 | £69.00 | £174.60 |
| 2 | Scotland | £64.80 | £33.30 | £10.70 | £78.70 | £187.50 |
| 3 | North West | £66.40 | £39.90 | £10.50 | £72.80 | £189.60 |
| 4 | London | £68.70 | £54.00 | £8.40 | £71.40 | £202.50 |
| 5 | Yorkshire and The Humber | £66.00 | £44.20 | £11.10 | £82.80 | £204.10 |
| 6 | West Midlands | £66.40 | £38.30 | £10.60 | £89.10 | £204.40 |
| 7 | East Midlands | £69.30 | £36.80 | £11.10 | £88.50 | £205.70 |
| 8 | Wales | £66.10 | £42.10 | £13.50 | £84.70 | £206.40 |
| 11 | South West | £73.00 | £52.70 | £12.60 | £98.30 | £236.60 |
| 12 | East of England | £74.20 | £48.00 | £11.80 | £107.30 | £241.30 |
| 13 | South East | £74.40 | £52.20 | £12.00 | £110.30 | £248.90 |
The data shows households in the North East spend the least across the selected categories, averaging £174.60 per week. By comparison, households in the South East spend £248.90 each week, around 43% more.
Transport accounts for one of the biggest regional differences. Weekly transport spending averages £69.00 in the North East but rises to £110.30 in the South East.
Food spending follows a similar pattern. Households in the South East spend £74.40 per week on food and non-alcoholic drinks, compared with £60.50 in the North East.
Restaurant and hotel spending is also noticeably higher across southern England, suggesting that households in these regions typically face higher discretionary costs alongside more expensive housing.
Thinking about relocating?
Affordability is often one of the biggest reasons people decide to move, whether that’s to reduce housing costs, improve their quality of life or free up more of their income each month.
If you’re planning to relocate and need to sell your current property quickly, working with an experienced cash house buyer can help simplify the process by avoiding lengthy property chains and giving you greater certainty over your moving timeline.
Methodology
Sell House Fast is a leading UK cash house buyer, helping homeowners achieve a guaranteed sale without the uncertainty or waiting times of the open market – completing sales in as little as seven days.
We scored each British local authority across the following factors:
- Annual pay
We used the ONS Annual Survey of Hours and Earnings to source median annual pay by local authority, based on place of residence.
- Average rent
We used the ONS Price Index of Private Rents, UK: monthly price statistics, to source the average private rent price for each local authority.
This was annualised by multiplying the monthly rent figure by 12.
- Housing affordability
We used the UK House Price Index to source the average house price for each local authority.
This was compared against the median annual pay by calculating a house price-to-income ratio.
- Income left after rent
We estimated the percentage of income left after rent by comparing the annual median pay with the annualised average rent.
- Estimated mortgage prices
We estimated the mortgage prices based on a 20% deposit of the average house price, at a 4.2% fixed rate, using May 2026 figures from the Bank of England. We then compared this against the median earnings to calculate a percentage of income left over after annual mortgage repayments. These are estimates only.
- Budget/value supermarket access
We used Geolytix supermarket retail point data to identify the number of budget/value supermarkets in each local authority.
The dataset included UK supermarket locations with addresses and coordinates. These coordinates were mapped to local authority boundaries using QGIS and ONS local authority boundary files.
Our list of budget supermarkets included Asda, Aldi, Lidl, Farmfoods, Iceland, and Heron.
The number of budget/value supermarkets was then normalised by population.
Each factor was normalised into a score out of 10.
For cost-based factors, such as rent and house price-to-income ratio, lower values were scored higher.
For income and access-based factors, such as annual pay and budget supermarket access, higher values were scored higher.
The final score was calculated by averaging all factors.
Regional expenditure:
ONS household expenditure was used as a separate supporting section, rather than as part of the main index, as this data was not available at the local authority level.
This section compares how spending varies by region across categories such as:
- Food and soft drinks
- Restaurants and hotels
- Transport services
- Alcoholic beverages
All data was collected in July 2026 and is correct as of then.