The Areas of England Most Affected by Noise, Light, and Other Sensory Disturbances
Most of us expect a bit of background noise or the odd streetlight outside our window, but in some parts of the country, those everyday disruptions are hard to escape. From constant traffic to bright night skies and neglected buildings, these sensory disturbances can take a real toll on how comfortable a place feels.
Research shows that these issues don’t just affect day-to-day life; they can have real consequences on well-being. Studies show long-term exposure to noise and light pollution has been linked to increased stress, disrupted sleep, and even heart problems.1
It’s not just about comfort, either. The sights and sounds that surround a property can also influence how others see it, making some homes more challenging to sell.
For homeowners who live in areas affected by these disturbances, cash house buyers can offer a faster route to sale when traditional buyers are put off by noise or pollution concerns.
How we created the sensory disturbance index
To understand where these disruptions are most common, we’ve explored which areas of England are most affected by sensory disturbances – and where homeowners are more likely to enjoy a calmer, more peaceful environment.
We created a sensory disturbance index that compares local authorities across several everyday factors.
We looked at:
- Noise complaints – To understand where unwanted sound is most common.
- Light pollution – To find the percentage of land exposed to the brightest artificial light at night.
- Vacant or derelict buildings – To show where neglected properties may affect how a neighbourhood looks and feels.
- Sewage works – To pinpoint areas most affected by nearby treatment sites, which could give off unpleasant smells.
- Greenhouse gas emissions – To get a sense of air quality across each area.
Each local authority was given a score for every factor. A higher score means greater exposure to these everyday disruptions.
The 10 areas with the most sensory disturbances
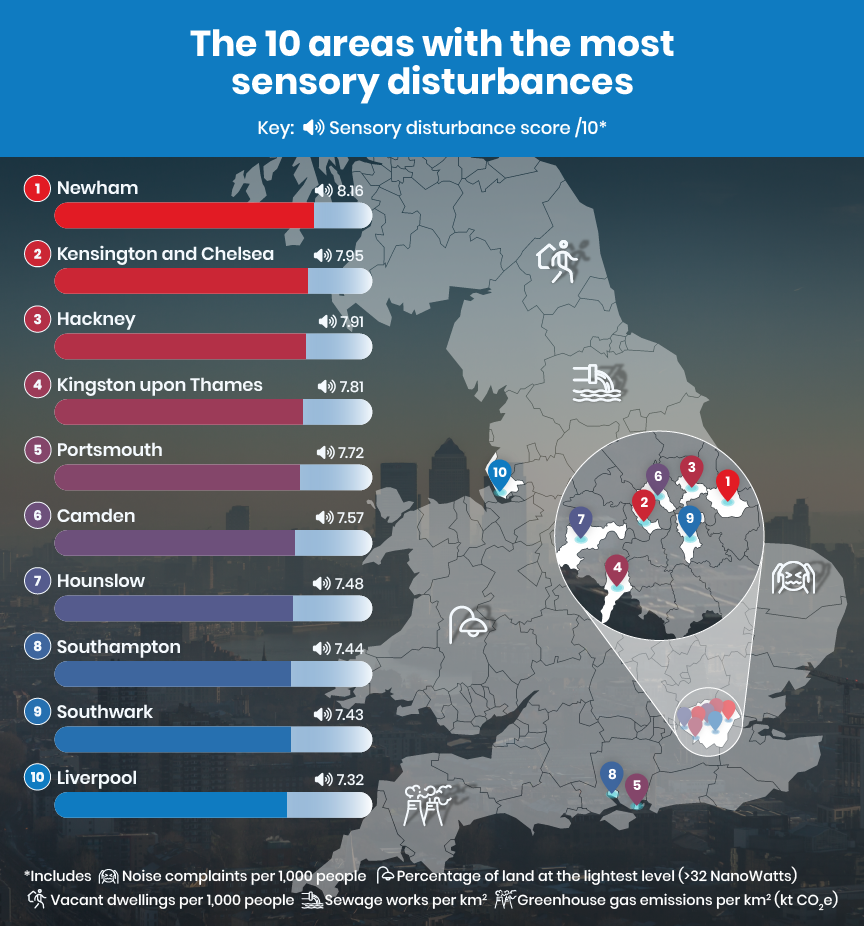
Some places never seem to switch off. The buzz of traffic, the glare of streetlights, and the hum of planes overhead can all become part of daily life. In these English towns and cities, peace and quiet could be hard to find.
Unsurprisingly, London areas feature heavily in the top spots, taking up 70% of the 10 places with the most sensory disturbances.
| Rank | Local authority | Noise complaints per 1,000 people | Percentage of land at the lightest level (>32 NanoWatts) | Vacant dwellings per 1,000 people | Sewage works per km2 | Greenhouse gas emissions per km2 (kt CO2e) | Sensory disturbance score |
| 1 | Newham | 17.9 | 96.1% | 10.7 | 4.7 | 24.8 | 8.16 |
| 2 | Kensington and Chelsea | 65.3 | 100.0% | 21.8 | 0.0 | 56.3 | 7.95 |
| 3 | Hackney | 19.3 | 98.4% | 9.4 | 1.1 | 29.2 | 7.91 |
| 4 | Kingston upon Thames | 6.6 | 8.2% | 19.1 | 1.1 | 14.1 | 7.81 |
| 5 | Portsmouth | 9.3 | 26.3% | 17.3 | 0.3 | 11.1 | 7.72 |
| 6 | Camden | 23.8 | 74.0% | 19.4 | 0.0 | 44.4 | 7.57 |
| 7 | Hounslow | 13.7 | 32.6% | 12.0 | 0.4 | 17.0 | 7.48 |
| 8 | Southampton | 10.2 | 18.4% | 12.8 | 0.7 | 12.5 | 7.44 |
| 9 | Southwark | 26.1 | 75.3% | 16.3 | 0.0 | 28.6 | 7.43 |
| 10 | Liverpool | 5.7 | 33.3% | 21.2 | 0.2 | 12.6 | 7.32 |
- Newham – Sensory disturbance score of 8.16 out of 10
Newham takes the top spot as the area most affected by sensory disturbances in England, scoring 8.16 out of 10. Compared with quieter parts of the country, residents experience significantly higher levels of environmental disruption across various measures:
- Light pollution affects almost the entire borough, with 96.1% of land exposed to bright artificial light, compared to an average of 20.4% across England.
- Greenhouse gas emissions reach 24.8 kt CO₂e per km², which is over double the national average.
- The highest number of sewage works per square kilometre, at just under five per km².
Newham’s regeneration continues to reshape the area, with major projects delivering around 8,000 new homes across Newham and Southwark.2 While this investment is revitalising parts of the borough, large-scale development like this also brings noise, light, and pollution that can heighten sensory pressures for those already living nearby.
- Kensington and Chelsea – Sensory disturbance score of 7.95 out of 10
Kensington and Chelsea may be known for elegant terraces, leafy garden squares, and some of the most desirable postcodes in London, but beneath that polished image, daily life comes with its fair share of disruption.
It records the highest rate of noise complaints in England, at 65.3 per 1,000 people, which could be due to a near-constant flow of traffic. Greenhouse gas emissions are also high, at 56.3 kt CO₂e per km² – more than two times those seen in Newham.
- Hackney – Sensory disturbance score of 7.91 out of 10
The area’s lively food scene, independent shops, and proximity to the city centre have made it a magnet for people over the years, but all that buzz comes at a sensory cost.
More than 98% of land is exposed to bright artificial light at night, one of the highest rates in the country. Noise complaints stand at 19.3 per 1,000 residents, while greenhouse gas emissions reach 29.2 kt CO₂e per km², both well above national averages.
Despite these sensory disturbances, house prices in Hackney have increased by 3.3%, contrasting the average 0.3% decrease across London as a whole.3 But could Hackney’s house prices have been even higher without the nearby noise and light pollution?
The 10 most peaceful places in England
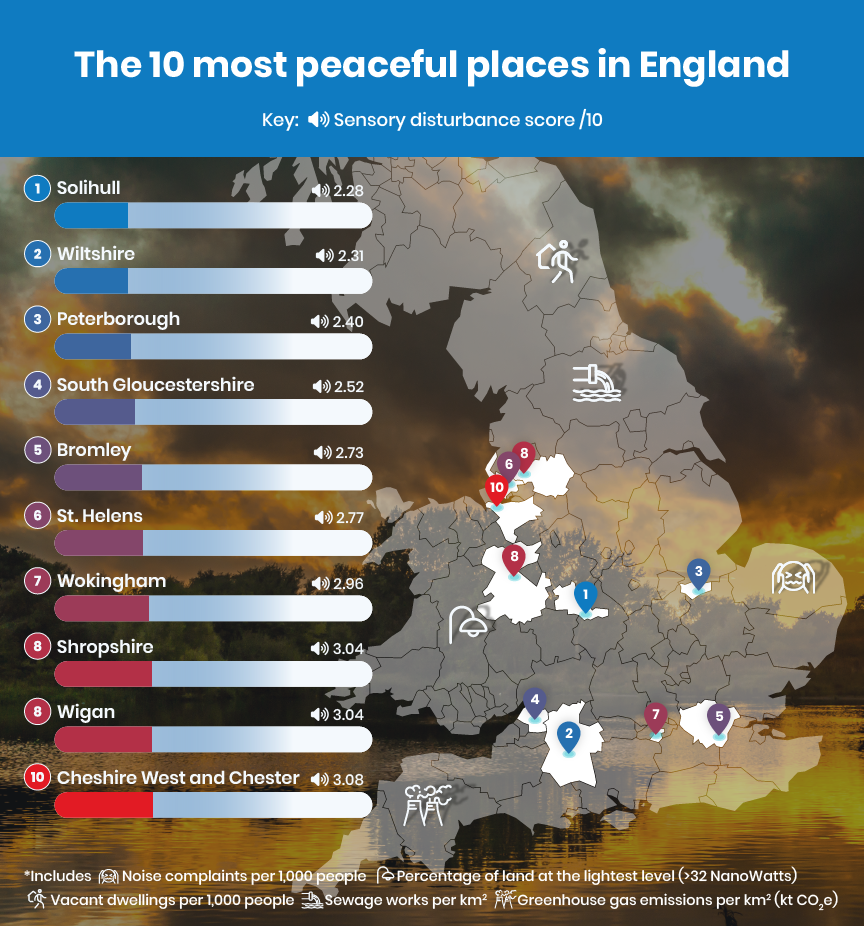
Not everywhere in England feels this hectic. Away from the city lights and constant noise, some areas offer the kind of peace and quiet that’s hard to find elsewhere. These places stand out for their cleaner air, darker skies and calmer streets, the simple qualities that make a home feel like an escape.
Many of the lowest-scoring areas are suburban or rural, where space, greenery, and low population density help minimise sensory pollution.
| Rank | Local authority | Noise complaints per 1,000 people | Percentage of land at the lightest level in the local district (>32 NanoWatts) | Vacant dwellings per 1,000 people | Sewage works per km2 | Greenhouse gas emissions per km2 (kt CO2e) | Sensory disturbance score |
| 1 | Solihull | 2.7 | 9.3% | 7.8 | 0.0 | 6.1 | 2.28 |
| 2 | Wiltshire | 0.9 | 0.1% | 12.2 | 0.2 | 0.9 | 2.31 |
| 3 | Peterborough | 1.6 | 1.1% | 10.5 | 0.3 | 3.1 | 2.40 |
| 4 | South Gloucestershire | 3.1 | 1.2% | 9.4 | 0.3 | 2.9 | 2.52 |
| 5 | Bromley | 4.0 | 2.7% | 11.1 | 0.0 | 6.0 | 2.73 |
| 6 | St. Helens | 3.1 | 5.7% | 11.1 | 0.0 | 7.8 | 2.77 |
| 7 | Wokingham | 3.3 | 1.1% | 8.3 | 0.5 | 3.7 | 2.96 |
| 8 | Shropshire | 2.5 | 0.0% | 14.2 | 0.3 | 0.8 | 3.04 |
| 8 | Wigan | 2.1 | 1.7% | 11.7 | 0.1 | 6.3 | 3.04 |
| 10 | Cheshire West and Chester | 0.7 | 3.0% | 11.1 | 0.3 | 3.7 | 3.08 |
- Solihull – Sensory disturbance score of 2.28 out of 10
Solihull is the calmest area in England, scoring just 2.28 out of 10. Compared with major cities, residents here experience very little environmental disruption:
- Noise complaints are among the lowest in the country at 2.7 per 1,000 people, and greenhouse gas emissions sit well below the national average.
- Only 9.3% of land is affected by artificial light at night, meaning residents enjoy far darker skies than in most parts of England. By comparison, places like Kensington and Chelsea, and Tower Hamlets, are fully exposed to artificial light.
- If you’re worried about living near sewage works, Solihull could be for you. There aren’t any within the borough, whereas in denser areas like Newham, there are almost five per square kilometre.
- Vacant dwellings here sit at 7.8 per 1,000 people, compared to more than 21 per 1,000 in some of England’s older urban areas, such as Liverpool or Blackpool.
This tranquillity is set to continue as well. According to Solihull Council, over two-thirds of the area is also designated as Green Belt land, which limits large-scale development and helps preserve its quiet character in the future.4
- Wiltshire – Sensory disturbance score of 2.31 out of 10
Wiltshire is second on the list, offering some of the cleanest air and darkest skies in England. Only 0.1% of the land here is affected by bright light, meaning you’ll likely avoid the glare of artificial lights at night.
Noise complaints are almost unheard of, at just 0.9 per 1,000 people, and greenhouse gas emissions sit among the lowest nationwide at 0.9 kt CO₂e per km².
Wiltshire’s low score is no coincidence. With over 80% of its land farmed, the county remains one of England’s most rural and spacious places.5 That means fewer tall buildings, less artificial lighting, and lower traffic intensity than you’ll find in other areas.
- Peterborough – Sensory disturbance score of 2.40 out of 10
Peterborough is the third most peaceful place in England, with a score of 2.40 out of 10. Despite steady population growth and an expanding economy, it manages to keep environmental disruption remarkably low.6
Only 1.1% of the area records light at the brightest level during the night, and greenhouse gas emissions are modest at 3.1 kt CO₂e per km². With noise complaints at just 1.6 per 1,000 people, it’s a level of calm that many larger places struggle to match.
Meanwhile, the city is also investing in its environment. Local initiatives, like the Cambridgeshire & Peterborough Fund for Nature, aim to double the quality and quantity of wildlife habitats and improve access to natural green spaces across the region.7
Noise pollution: The loudest and quietest places to live
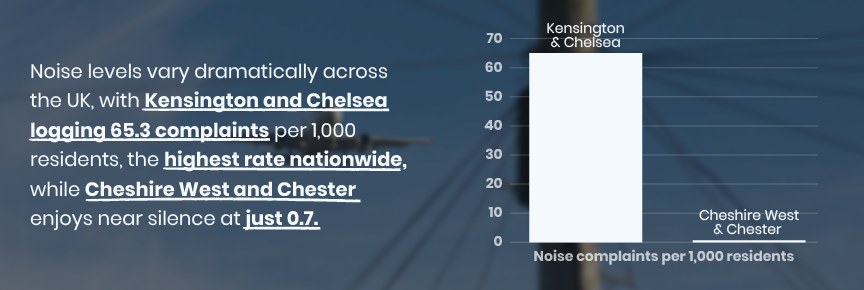
Noisiest area: Kensington and Chelsea – 65.3 noise complaints per 1,000 people
Quietest area: Cheshire West and Chester – 0.7 noise complaints per 1,000 people
For people living in Kensington and Chelsea, noise is part of daily life. With 65.3 complaints per 1,000 residents, it’s England’s busiest borough for reported disturbances. That’s no surprise for an area that hosts major venues like the Royal Albert Hall and Olympia London, alongside a constant stream of hotels, restaurants, and late-night bars catering to visitors.
In Cheshire West and Chester, life is much quieter, over 93 times quieter, in fact. Only 0.7 residents per 1,000 have filed complaints – the lowest rate in the country. Here, the lower population density helps residents enjoy the kind of peace and quiet that city dwellers often dream about.
Light pollution: England’s brightest and darkest skies
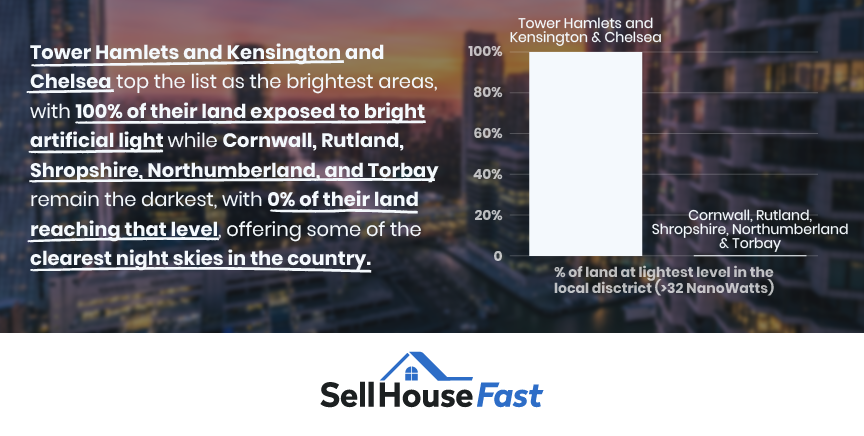
Lightest areas: Tower Hamlets and Kensington and Chelsea – 100.0% of land at the lightest level (>32 NanoWatts)
Darkest areas: Cornwall, Rutland, Shropshire, Northumberland, and Torbay – 0.0% of land at the lightest level (>32 NanoWatts)
For residents of Kensington and Chelsea and Tower Hamlets, darkness is hard to come by. Every inch of land in both boroughs is exposed to bright artificial light at night, from King’s Road to Canary Wharf, making them the brightest places in England. Streetlights, illuminated shopfronts and 24-hour traffic mean the glow rarely fades – even long after midnight.
In contrast, life in Cornwall, Rutland, Shropshire, Northumberland, and Torbay couldn’t feel more different. These areas have 0% of land at the brightest light level, offering some of the clearest night skies in the country.
Empty homes and abandoned buildings: Where they’re most common
Area with the most vacant dwellings: Torbay – 22.4 vacant dwellings per 1,000 people
Area with the fewest vacant dwellings: Wandsworth – 4.1 vacant dwellings per 1,000 people
In Torbay, empty homes are a familiar sight. With 22.4 vacant dwellings per 1,000 people, it has the highest rate of abandoned buildings in England. As a coastal town built around tourism, many of its properties also double as second homes or holiday lets, often standing empty for long stretches once summer ends.
Over in Wandsworth, just 4.1 dwellings per 1,000 people stand empty, meaning it’s unlikely your home is in view of one. Demand for housing in this part of South London is so strong that even small flats are snapped up quickly.
Living near sewage works: The areas most affected
Area with the most sewage works: Newham – 4.7 sewage works per km2
Most people never have to think about living near a sewage works, as 44 local authorities across England don’t have any nearby. But in Newham, it’s a different story. With 4.7 sewage works per square kilometre, it’s the most affected area in the country.
For residents, that can mean more than just unpleasant smells. Proximity to waste treatment sites can influence local air quality, traffic, and even how buyers perceive a property.
How these factors impact property value
Studies show that environmental and sensory disturbances aren’t just nuisances; they can play a real role in how a property is priced. Buyers often make decisions based on how an area looks, feels and sounds, and that first impression can be the difference between a quick sale and a lower offer.
For example, one study found that a 1 decibel increase in road, rail, and aircraft noise can decrease value by between 0.18% and 0.55%.8 This could be just under £2,000 less for a £350,000 house.
Other forms of disturbance can also impact homes. Properties near abandoned or neglected buildings often appear less desirable to buyers, as they can change how safe or well-kept a neighbourhood feels.
And while sewage works are unavoidable in some areas, their presence nearby can influence how much people are willing to pay.
But what can you do about this?
What you can do to protect and boost your home’s appeal
While you can’t always control what happens around your property, there’s plenty you can do to make sure your home stands out for the right reasons.
If you’re affected by environmental issues like noise, light or neglected surroundings, start by raising your concerns with your local council. Many have dedicated teams for noise, pollution and planning complaints, and even small changes can make a noticeable difference.
At home, focus on the things you can influence:
- Refresh your kerb appeal. A neat exterior and welcoming entrance instantly lift perception. Repainting your front door or maintaining greenery can go a long way.
- Make the most of your outdoor space. Tidy gardens, potted plants or screening can draw the eye away from nearby eyesores and create a sense of privacy.
- Add value over time. Small improvements, like landscaping or replacing old fencing, can make your property (and your road) feel better maintained and increase the ceiling price of your whole street.
- Know your options if selling. If location or nearby disturbances are putting buyers off, consider selling to a cash house buyer. It offers a faster, more certain sale without the risk of falling through.
Even small improvements can make a big difference to how buyers perceive your property and to how it feels to live in day to day.
Methodology
Sell House Fast is a leading UK cash house buyer, helping homeowners achieve a guaranteed sale without the uncertainty or waiting times of the open market. By buying properties directly for cash, we make it possible to complete a sale in as little as seven days – providing peace of mind for sellers facing time-sensitive moves or difficult market conditions.
Because we understand how location and environment can influence both property value and buyer demand, we wanted to explore the impact of ‘sensory disturbances’. The everyday environmental factors that can make some areas harder to live and sell in.
To understand this more clearly, we analysed the following datasets:
We collected the number of noise complaints per 1,000 people using Fingertips data.
We then took figures on light pollution from CPRE. To do this, we took the percentage of land that was at the lowest light level (<0.25 NanoWatts) and the highest light level (>32 NanoWatts).
Then, we took the number of vacant dwellings (i.e. derelict/abandoned buildings) from official government data.
Using government data again, we took greenhouse gas emissions per km2 (kt CO2e).
Lastly, we took the number of sewage works in each local authority from OpenStreetMap.