Common Property Pitfalls That Make Your Home Harder to Sell
Selling your home can feel overwhelming, especially when unsure how long it might take.
To ease your mind, the Sell House Fast team has explored property sale times across the UK’s 50 largest cities. We’ve broken these findings down by property features to determine what aspects of your home could affect its time on the market.
We’ve also surveyed the public to find out the most common reasons why house sales fail, from buyers with cold feet all the way to gazumping.
If you’re looking for a safe option where you don’t have to wait months for your house to go off the market, choose Sell House Fast and get cash for your house in a timeframe that suits you.
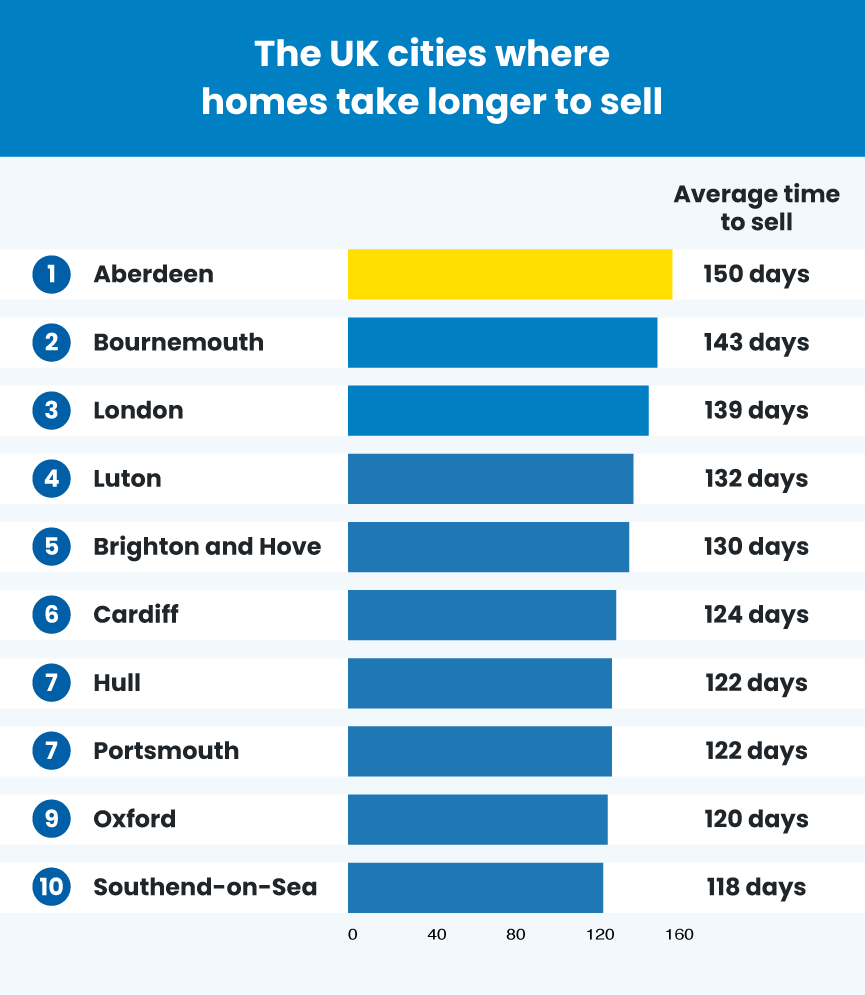
The UK cities where homes take longer to sell
| Rank | City | Average time to sell (days) |
| 1 | Aberdeen | 150 |
| 2 | Bournemouth | 143 |
| 3 | London | 139 |
| 4 | Luton | 132 |
| 5 | Brighton and Hove | 130 |
| 6 | Cardiff | 124 |
| 7 | Kingston upon Hull | 122 |
| 7 | Portsmouth | 122 |
| 9 | Oxford | 120 |
- Aberdeen | Average time to sell: 150 days
Aberdeen homes take the longest time to sell, averaging about 150 days, or approximately five months. Flats, properties priced over £1 million, and one-bedroom houses tend to linger on the market the longest.
Semi-detached homes generally sell quicker in this city, up for sale for 107 days on average. There is a sweet spot in prices as well. While properties over a million take the longest, those priced between £500,000 and £1,000,000 take 79 fewer days to sell.
- Bournemouth | Average time to sell: 143 days
Bournemouth properties are often on the market for a week less than places in Aberdeen, but it still takes a long time to find a buyer. Like in Aberdeen, flats take a long time to shift, with an average of 166 days on sale.
However, four-bedroom properties are especially popular here, only sitting on sale for 117 days — 50% quicker than houses with just one more bedroom.
- London | Average time to sell: 139 days
Despite the capital’s lure for some people, London’s high prices mean homes typically remain on the market for around 139 days, or just under 20 weeks.
Luxury five-bedroom properties and one-bedroom flats tend to experience longer selling periods. In contrast, more affordable family homes, especially terraced and semi-detached houses, usually sell quicker due to higher demand.
The UK cities where homes sell fastest
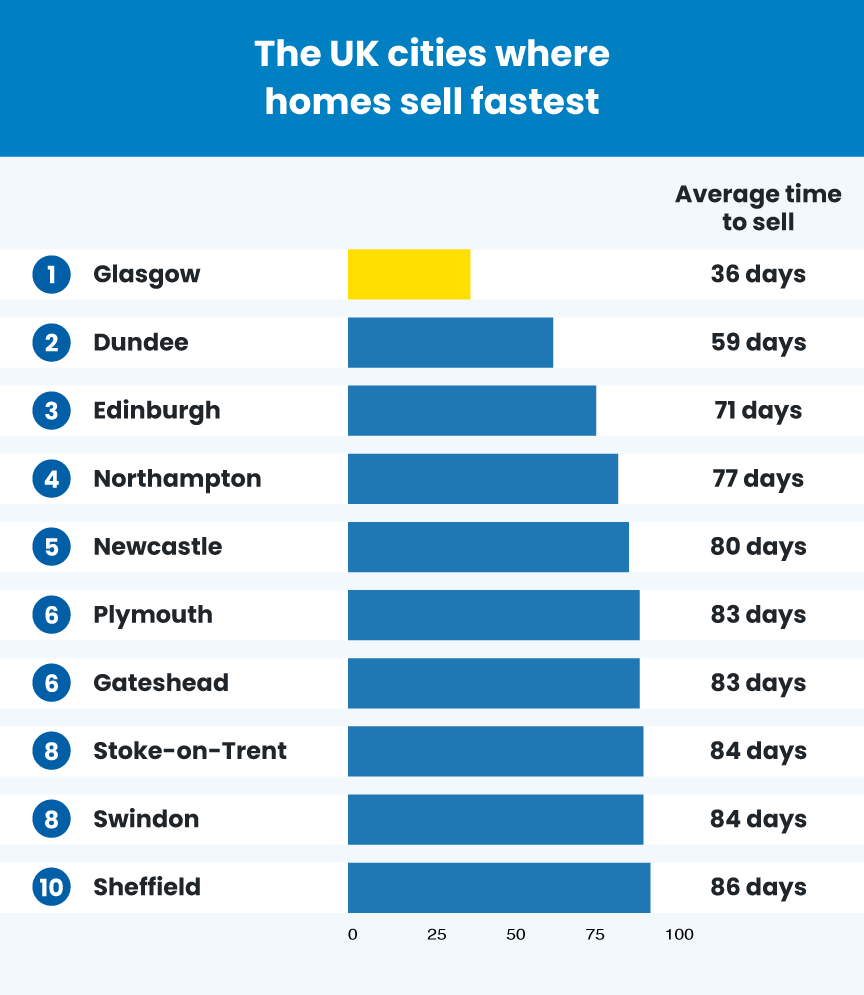
Moving on from Aberdeen, the top three cities where houses were taken off the market the quickest are in Scotland. This could be partly due to the fact that solicitors are responsible for marketing properties, compared to England, where it is down to estate agents.
Sellers will also typically provide a survey right at the beginning of the process, which the buyer can use to get their mortgage approved.
| Rank | City | Overall average time to sell (days) |
| 1 | Glasgow | 36 |
| 2 | Dundee | 59 |
| 3 | Edinburgh | 71 |
| 4 | Northampton | 77 |
| 5 | Newcastle upon Tyne | 80 |
| 6 | Plymouth | 83 |
| 6 | Gateshead | 83 |
| 8 | Stoke-on-Trent | 84 |
| 8 | Swindon | 84 |
| 10 | Sheffield | 86 |
- Glasgow | Average time to sell: 36 days
Glasgow’s housing market is exceptionally quick, with properties selling in just over a month on average.
Like London, the quickest sales are for semi-detached and terraced homes, popular among young professionals and families drawn to the area. Detached properties may take slightly longer, but the 51 days is still way below the national average of 130.
- Dundee | Average time to sell: 59 days
Homes in Dundee typically sell within around two months (59 days). This is 87% quicker than the sale times seen in Aberdeen.
If you have a terraced, one-bedroom house priced between £200,000 and £300,000, you’re in luck as these features sell the fastest in this area. Larger, detached homes are trickier to get rid of.
- Edinburgh | Average time to sell: 71 days
Edinburgh also has a fast-moving market, with properties usually selling in about 71 days (just over 10 weeks). Although this is 65% slower than seen in Glasgow, it is still far quicker than the UK average of 103 days.
House hunters in the Scottish capital are particularly keen for semi-detached houses, especially if they have two bedrooms.
How can home features affect sales times?
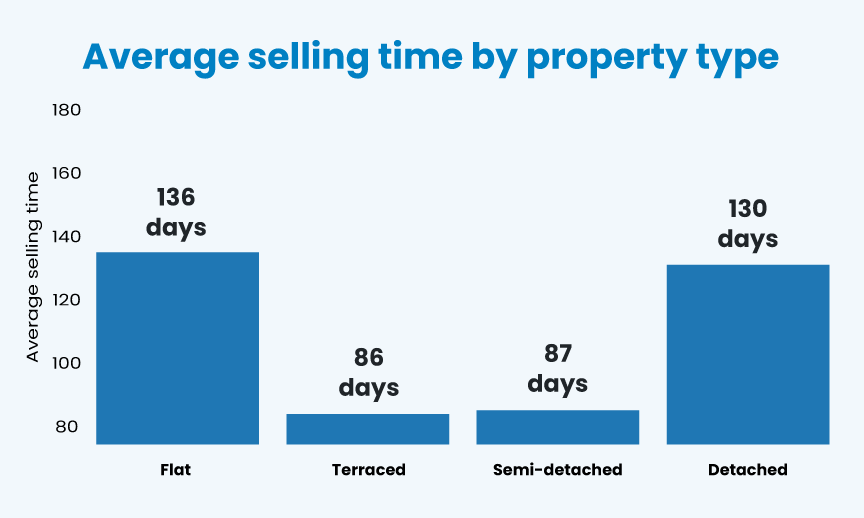
| Average selling time by property type (days) | Flat | 136 |
| Terraced | 86 | |
| Semi-detached | 87 | |
| Detached | 130 | |
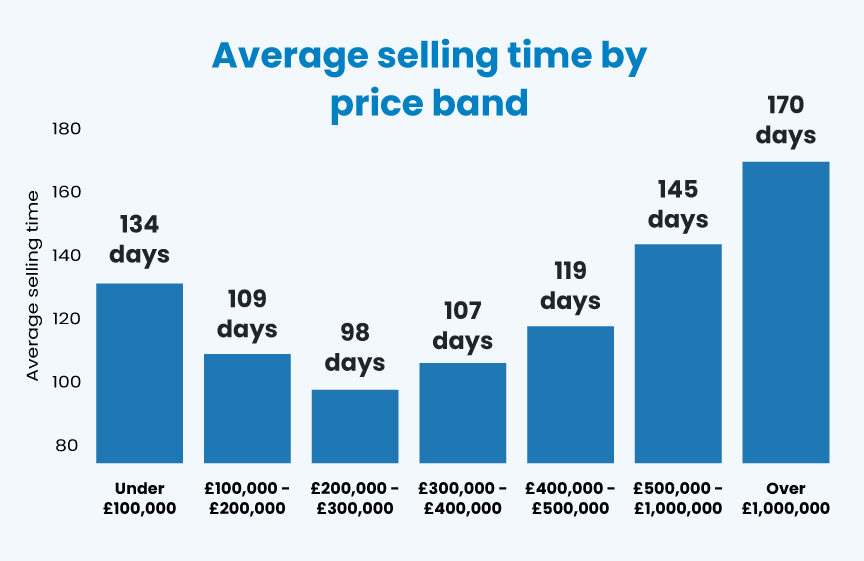
| Average selling time by price band (days) | Under £100,000 | 134 |
| £100,000 to £200,000 | 109 | |
| £200,000 to £300,000 | 98 | |
| £300,000 to £400,000 | 107 | |
| £400,000 to £500,000 | 119 | |
| £500,000 to £1,000,000 | 145 | |
| Over £1,000,000 | 170 | |
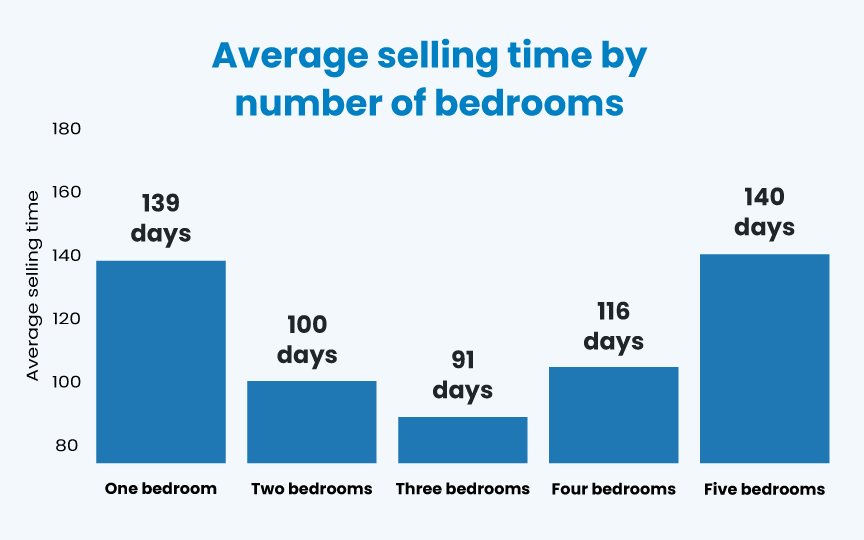
| Average selling time by number of bedrooms (days) | One bedroom | 139 |
| Two bedrooms | 100 | |
| Three bedrooms | 91 | |
| Four bedrooms | 116 | |
| Five bedrooms | 140 |
As you may expect, properties over £1 million take the longest to sell, often taking around 170 days (almost six months). This could be down to fewer buyers in this price bracket, meaning finding the right person for the house can be more time-consuming.
The perfect price range is between £200,000 and £300,000, as houses in this bracket were only on sale for 98 days — almost 54% quicker.
In terms of property type, terraced homes sell quickly, usually finding buyers in just under three months (86 days), just one day quicker than semi-detached houses.
Three-bedroom properties fly off the market, with an average sale time of 91 days, compared to five-bedroom houses. These bigger estates typically take 20 weeks to sell due to the reduced demand for larger homes.
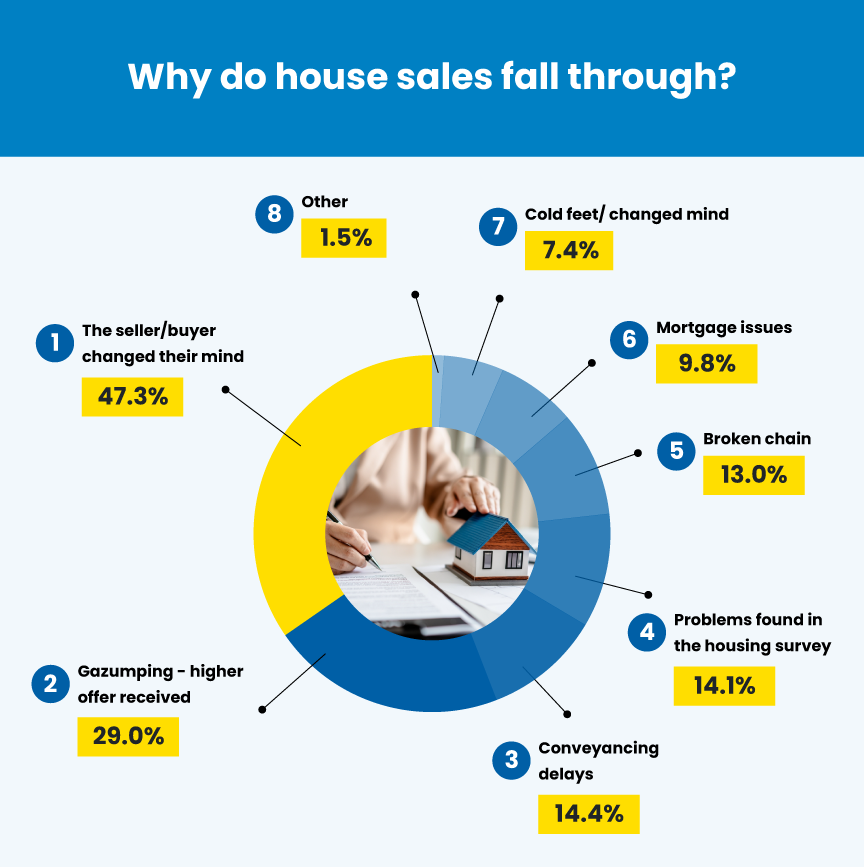
Why do house sales fall through?
House sales falling through is understandably stressful, and unfortunately, it’s pretty common. But why does it happen? We surveyed UK residents to discover the most common reasons behind a house chain breaking down.
| Rank | Reason | Percentage of respondents |
| 1 | The seller/buyer changed their mind | 47.3% |
| 2 | The seller/I received a higher offer (also known as ‘gazumping’) | 29.0% |
| 3 | Conveyancing delays | 14.4% |
| 4 | Problems found in the housing survey | 14.1% |
| 5 | A broken chain | 13.0% |
| 6 | Mortgage issues | 9.8% |
| 7 | I got cold feet/changed my mind | 7.4% |
| 8 | Other | 1.5% |
- Buyer or seller changed their mind (47.3%)
Almost half of all sales fail simply because one party has second thoughts. This is especially common in Norwich, where almost two-thirds (62.5%) of failed moves were due to cold feet.
Clear communication and setting realistic expectations at the outset can help reduce the likelihood of either party having second thoughts later.
2. Higher offer received by seller (29.0%)
Just under a third (29.0%) of collapsed transactions happen when sellers receive higher offers, which is commonly known as gazumping. The survey indicated this was particularly common in the fast-moving markets like Belfast (38.9%) and Glasgow (38.6%), where competition is high.
To minimise this risk, buyers should get their financing sorted early and be in the best position possible to move forward with the sale. Sellers, meanwhile, should carefully weigh the benefits of higher offers against potential delays or risks of losing reliable buyers.
3. Conveyancing delays (14.4%)
Conveyancing delays are another common issue, affecting around one in six (14.1%) house sales. These delays often arise due to paperwork complications or slow communication between solicitors. Men were more likely to experience this (16.4%), and almost one in four (22.7%) people aged 25 to 34 cited this as the reason for their failed house sale.
Choosing a recommended, proactive conveyancer can greatly reduce delays and potential headaches. Additionally, providing all required documentation as soon as possible will help smooth the process considerably.
The cost of a house sale falling through
A house sale failing through isn’t just heartbreaking, it can lose you money as well. It’s important to thoroughly research mortgage brokers, conveyancers, and survey fees before signing any contracts, so you know exactly how much and when you’ll be charged.
Buyers
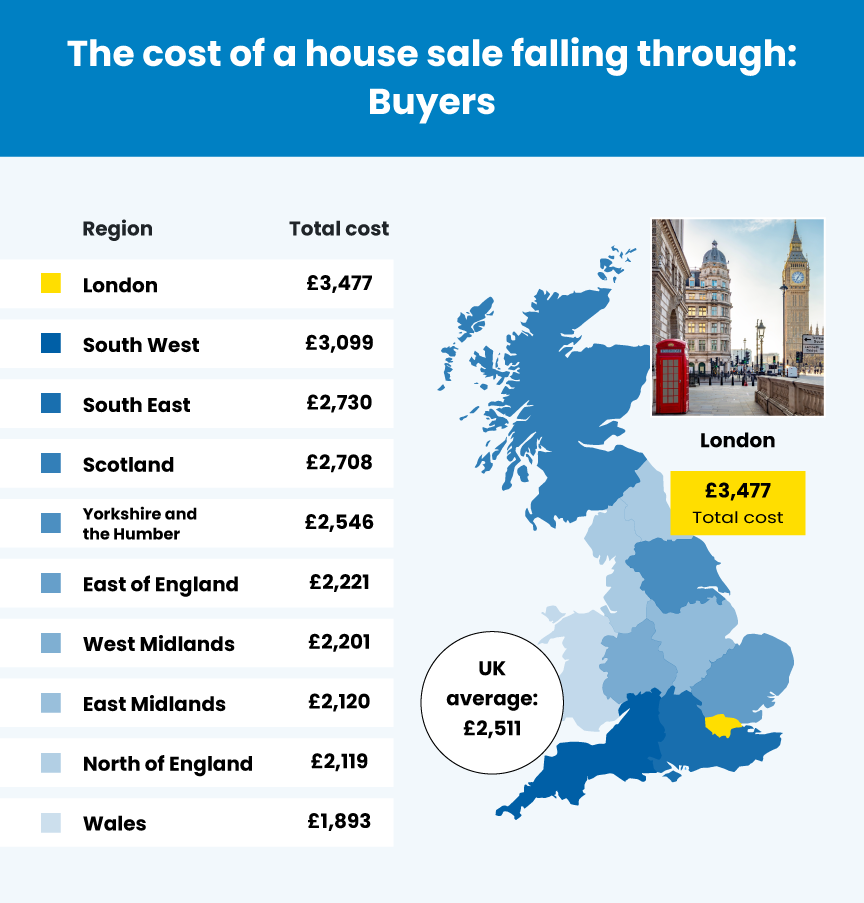
| Region | Average conveyancing fee | Average survey level 1 cost | Mortgage advice | Total cost |
| London | £2,427 | £600 | £450 | £3,477 |
| South West | £2,049 | £600 | £450 | £3,099 |
| South East | £1,680 | £600 | £450 | £2,730 |
| Scotland | £1,658 | £600 | £450 | £2,708 |
| Yorkshire and the Humber | £1,496 | £600 | £450 | £2,546 |
| East of England | £1,171 | £600 | £450 | £2,221 |
| West Midlands | £1,151 | £600 | £450 | £2,201 |
| East Midlands | £1,070 | £600 | £450 | £2,120 |
| North of England | £1,069 | £600 | £450 | £2,119 |
| Wales | £843 | £600 | £450 | £1,893 |
| UK | £1,461 | £600 | £450 | £2,511 |
If you’re buying, a collapsed sale could cost you, on average, £2,511, including mortgage application fees, surveys, and solicitor costs. However, this could vary dramatically depending on where you live due to the difference in conveyancing fees — the total cost ranges from £3,477 in London to £1,893 in Wales.
It’s also important to factor in other ongoing expenses, such as continued rent payments, storage fees, temporary accommodation costs, and even mortgage renewal fees.
Keep in mind that all is not lost if your sale does fall through. Many solicitors and mortgage advisors will only change once you find a property.
Sellers
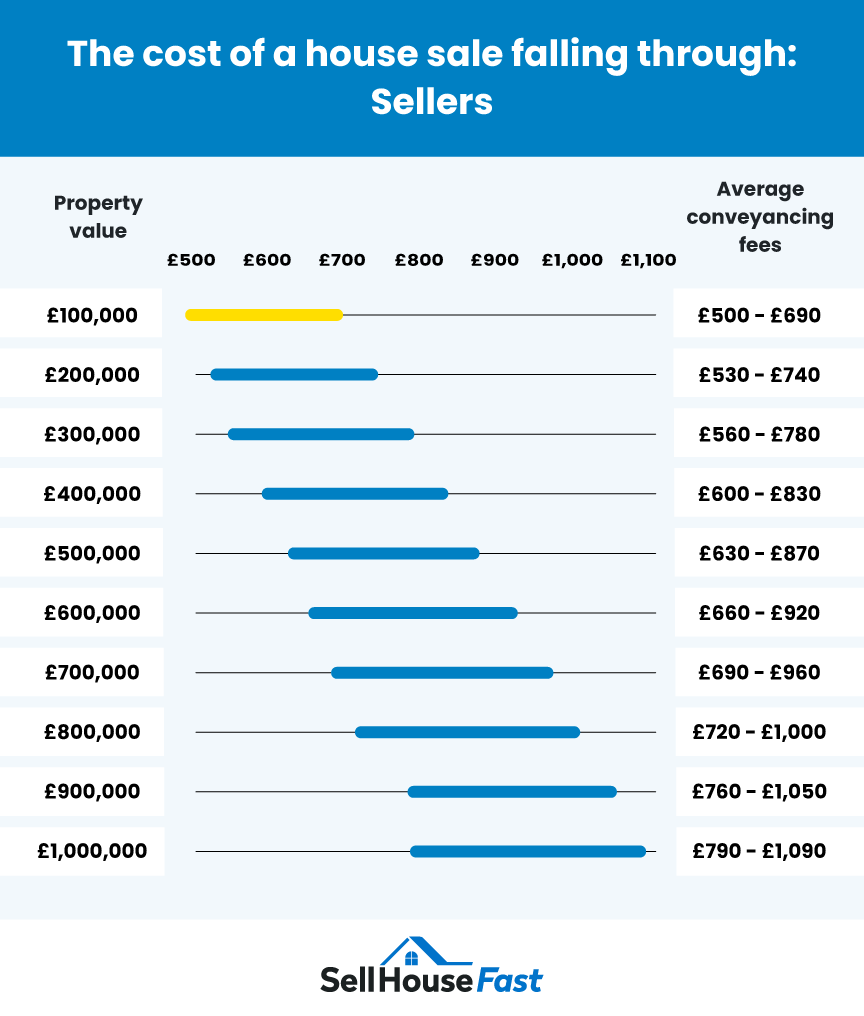
| Property value | Average conveyancing fees |
| £100,000 | £500 – £690 |
| £200,000 | £530 – £740 |
| £300,000 | £560 – £780 |
| £400,000 | £600 – £830 |
| £500,000 | £630 – £870 |
| £600,000 | £660 – £920 |
| £700,000 | £690 – £960 |
| £800,000 | £720 – £1,000 |
| £900,000 | £760 – £1,050 |
| £1,000,000 | £790 – £1,090 |
For sellers, the average financial loss is lower if a house sale does fail, as it is mainly based on lost conveyancing fees. Like with buyers, it’s essential to check with your chosen solicitor, as while some do charge if the sale falls through, some do not.
Based on the property value, sellers could lose anywhere from £500 right up to £1,090 through these solicitor fees.
Other expenses to plan for include ongoing mortgage and home insurance payments while finding a new buyer.
Methodology
We took the 50 biggest UK cities by population and used Home.co.uk data to find the mean selling time by the following property types:
- Flat
- Terraced
- Semi-detached
- Detached
We also collected data for the mean selling time by price band and number of bedrooms.
To estimate the average price of a house sale falling through, we added together the following:
- Solicitor/conveyancing fees for the buyer: https://www.comparemymove.com/guides/conveyancing/average-conveyancing-fees
- Solicitor/conveyancing fees for the seller: https://www.reallymoving.com/moving-cost-calculator
- Survey and valuation costs: https://hoa.org.uk/advice/guides-for-homeowners/i-am-buying/how-much-does-a-house-survey-cost/
- Mortgage broker/application fees: https://www.unbiased.co.uk/discover/mortgages-property/buying-a-home/mortgage-broker-fees
Lastly, we surveyed 1,458 UK residents, asking the question: Why did your house purchase/sale fall through?
All data was collected in May 2025 and is correct as of then.