England’s Dirtiest Areas
A messy street doesn’t just look bad. It can also hurt your wallet. According to Keep Britain Tidy, littered streets can reduce a house’s value by 12%.1
From sewage spills to fly-tipping, some parts of England are becoming hotspots for waste. Councils are paying for the clean-up, but homeowners are paying in another way. If you are trying to sell your home, graffiti and rubbish nearby could mean lower offers than expected. That is why more sellers choose to work with cash house buyers, who offer quicker and more straightforward sales.
So, which parts of England are struggling the most? We looked at government data to reveal:
- The areas with the most reports of graffiti
- The areas with the most littering
- The areas with the most and least incidents of fly-tipping
- The most polluted areas
- The areas with the most sewage spills
- The local authority which spends the most on waste collection
Key findings
- Newham is England’s litter capital with 49,881 fines issued, equal to 13,319 per 100,000 people
- Camden is the biggest graffiti hotspot in England (14,280 reports), and the fly-tipping capital (157.5 incidents per 1,000 people)
- Derbyshire Dales recorded 5,056 sewage spills per 100,000 people, the highest in England
- North Lincolnshire is England’s most polluted area, producing 33.8 tonnes of greenhouse gases per person
- Oadby and Wigston crowned England’s cleanest area for fly-tipping with just 0.2 incidents per 1,000 people
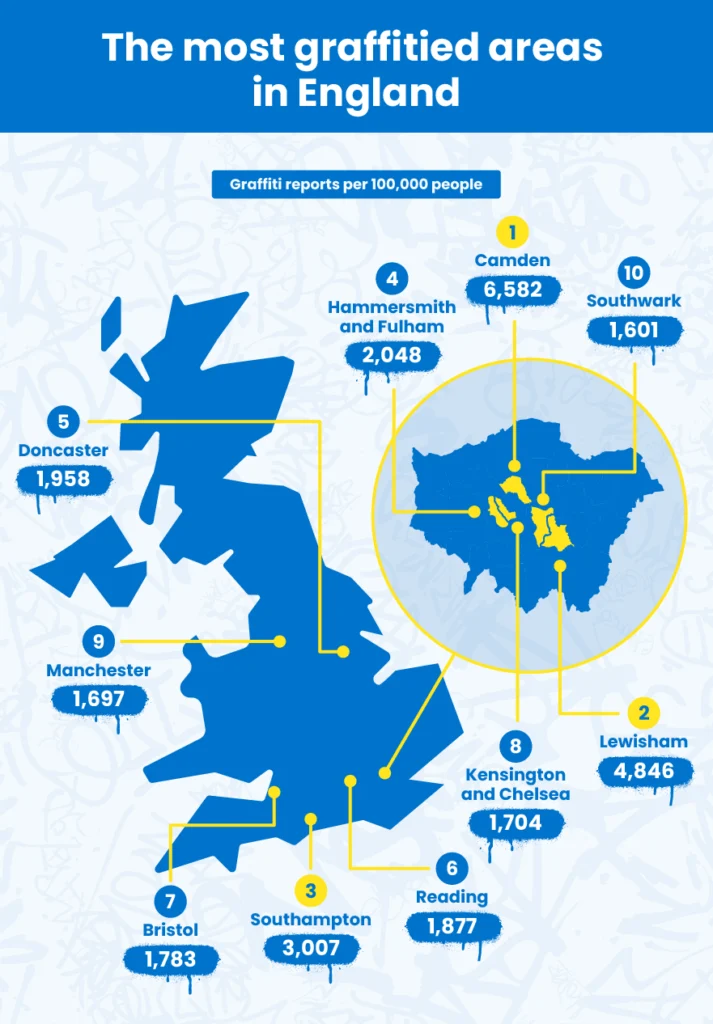
The most graffitied areas in England
| Graffiti reports | |||
| Rank | Council | Total | Per 100,000 people |
| 1 | Camden | 14,280 | 6,582 |
| 2 | Lewisham | 14,598 | 4,846 |
| 3 | Southampton | 7,800 | 3,007 |
| 4 | Hammersmith and Fulham | 3,864 | 2,048 |
| 5 | Doncaster | 6,262 | 1,958 |
| 6 | Reading | 3,433 | 1,877 |
| 7 | Bristol | 8,817 | 1,783 |
| 8 | Kensington and Chelsea | 2,462 | 1,704 |
| 9 | Manchester | 10,009 | 1,697 |
| 10 | Southwark | 5,040 | 1,601 |
There is more graffiti in Camden than in any other area, with 6,582 reports per 100,000 people
According to Camden Town in London, the history of graffiti dates back more than 50 years. It began to emerge in the 1970s as a form of self-expression, which matched the punk subculture that was present in Camden at the time. Over the years, local and international artists used the streets of Camden as their canvas, turning bland walls into murals and illustrations. There is street art all over Camden, and if you want to see it for yourself, you can find it at:
- Kentish Town Road
- Bayham Street
- Buck Street
- Castlehaven Road
- Stucley Place
- Harmwood Street
Despite its exciting history with street art, not everyone in the area is on board. In 2024, Camden’s residents made more than 14,200 reports about graffiti, equating to over 6,500 reports about graffiti per 100,000 people.
Although Camden is the worst offender, London appears to be the graffiti capital of England, with five London boroughs in the top 10 for graffiti reports.
The worst places in England for littering
| Littering Fixed Penalty Notices | |||
| Rank | Council | Total | Per 100,000 people |
| 1 | Newham | 49,881 | 13,319 |
| 2 | Greenwich | 21,093 | 7,042 |
| 3 | Milton Keynes | 18,847 | 6,161 |
| 4 | Manchester | 35,143 | 5,960 |
| 5 | Merton | 12,644 | 5,786 |
| 6 | Waltham Forest | 13,836 | 4,946 |
| 7 | Wolverhampton | 10,223 | 3,635 |
| 8 | Southampton | 8,183 | 3,154 |
| 9 | Doncaster | 9,549 | 2,986 |
| 10 | Bristol | 11,088 | 2,243 |
Newham’s residents are the worst offenders for littering, with 13,319 penalties per 100,000 people
Newham has the most litter bugs, with residents receiving almost 50,000 penalties for littering – that means more than a quarter (26.7%) in the area could have received one. The total number of littering incidents in Newham was significantly more than in any other area on our list, with Manchester taking second place with 35,143 littering penalties.
According to Newham Council, they have over 1,800 public litter bins and provide weekly rubbish collections.2 However, according to the Office for National Statistics, Newham’s high littering rate could be due to its population density of over 25,000 people per square mile, the eighth-highest in England.3
This creates a higher volume of waste, which can be more difficult for the council to effectively manage. Other, more general reasons which can contribute to a higher rate of littering include:
- Limited resources. Budget cuts or constraints and a lack of staff can make it difficult for the council to manage its waste adequately.
- Lack of community pride. If a resident is unhappy with the area they live in, then they often don’t care or feel responsible for maintaining cleanliness.
- Public perception. Seeing litter on the streets can give the impression that it’s normal, adding to and worsening the problem.
Which areas fly-tip the most and the least?
Camden’s residents fly-tip more than any other area in England
The fly-tipping hotspot in England is Camden, with over 150 fly-tipping incidents per 1,000 people. Councillor Adam Harrison, Cabinet Member for Planning and a Sustainable Camden, described fly-tipping as one of the biggest issues impacting this neighbourhood and costs taxpayers over £685,000 a year to clean up.4
Something that may contribute to Camden’s first-place ranking is its ‘clear all’ policy, which encourages waste collectors to remove all rubbish from the streets. Camden Council and waste management company Veolia introduced this policy in an effort to keep Camden’s high street accessible. Although the intention is good, it effectively means that residents can leave as many bags as they wish on the street, knowing it will be collected due to this policy.
In an attempt to reduce the rate of illegal waste dumping, Camden has expanded its enforcement team and increased fines to try to deter people from fly tipping. But clearly, more needs to be done.
Oadby and Wigston is the tidiest local authority
Oadby and Wigston’s residents fly-tip less than any other local authority, with just 0.2 incidents per 1,000 people.
However, Oadby and Wigston aren’t completely innocent of fly-tipping incidents. According to the BBC, this borough collected about 25 tonnes of illegally dumped rubbish from a fly-tipping hotspot near an industrial estate on Magna Road in 2025.5 This has forced the council to install CCTV cameras in this area to deter people in the future.
The most polluted area in England
North Lincolnshire is the most polluted area in England, with 33.8 greenhouse gases per capita
North Lincolnshire’s first place ranking is mainly due to its industrial base, which consists of industries like power generation and chemical production. These industries are carbon-intensive, and significantly contribute to a high output of greenhouse gases.
This local authority is working to change this. In May 2025, plans for a green energy park were approved, which will use up to 760,000 tonnes of waste into enough low-carbon energy to power more than 200,000 homes. Not only will this reduce greenhouse gas emissions, but it will reduce the amount of waste going into landfills.
The area with the most sewage spills
Derbyshire Dales is the sewage capital of England, with 5,056 sewage spills per 100,000 people
The area with the most sewage spills is Derbyshire Dales, with around one sewage spill for every 20 people living there. Sewage dumped into local rivers occurred 2,975 times in 2022, and 3,658 times in 2023. This was a 23% rise between the two years.
In 2023, Derbyshire Dales’ rivers also suffered from 31,359 hours of sewage being dumped into rivers, a shocking 43% rise from the previous year. Some of the affected rivers include the River Derwent and the River Wye.
The local authority that spends the most on waste collection
Kensington & Chelsea spends more on waste collection than any other area, with an expenditure of £5.54 million per 100,000 people
Flytipping is a considerable problem for Kensington & Chelsea, with approximately 48 incidents per thousand people reported to the council last year.
How to sell your house in an undesirable area
When buying a house, you invest in the neighbourhood and the city. Therefore, it’s important to be happy when buying your home.
But what if you live in one of the dirtiest areas uncovered in our report? Well, selling your home can be slightly harder.
Don’t worry, because our managing director Jack Malnick has offered his expertise on what your best option is:
“Of course, we want you to be happy in your home. But that’s not always possible. Whether you live in North Lincolnshire and deal with its pollution, or live in Camden and hate the graffiti and fly-tipping, selling might be harder in these areas.
“So, what are your options?
“One of the most effective ways to sell is a cash purchase. A cash purchase is quicker as it bypasses the mortgage applications and approvals. As soon as you give us a call, we arrange a viewing and submit an initial offer. If this is accepted, our solicitors will begin the purchasing process instantly.
“Opting for a cash purchase will save you the typical stresses that come with selling your house, and ensure you get your money quickly.”
Methodology
Sell House Fast is a leading UK cash house buyer, helping homeowners secure a guaranteed property sale without the delays of the traditional estate agent route. By purchasing directly for cash and handling the entire process, we offer a stress-free alternative that can be completed in as little as seven days.
As the area is just as important (if not more!) than the house itself, we wanted to see which places could be bringing down house value.
We sent Freedom of Information requests to the councils of the 50 biggest towns and cities outside of London, as well as each London borough, requesting the following information from the last three full calendar years (2022-24):
- The number of graffiti reports received by the council from members of the public or council staff, regardless of whether they were resolved or actioned.
- The number of Fixed Penalty Notices (FPNs) issued for littering offences.
These were then calculated per 100,000 people. Any councils that didn’t respond by August 21st, 2025, or that responded with data that wasn’t comparable with the other councils were removed.
Fly tipping incidents per local authority were sourced from the Department for Environment, Food & Rural Affairs’ fly-tipping statistics for England.
Greenhouse gas emissions per local authority were sourced from the Department for Energy Security and Net Zero’s UK local authority and regional greenhouse gas emissions statistics, 2005 to 2023 (table 1.1)
Sewage spills per local authority were sourced from the Rivers Trust’s Event Duration Monitoring – Storm Overflows – 2024 (England and Wales)
Waste collection expenditure per local authority was sourced from the Ministry of Housing, Communities and Local Government’s Local Authority Revenue Expenditure and Financing, England: 2024 to 2025 – Individual Local Authority Data (Outturn), specifically the Revenue Outturn Cultural, Environmental, Regulatory and Planning Services (RO5) dataset. Figures represent net current expenditure (actual spend) on waste collection for each authority.
All data was collected in August 2025 and is correct as of then.